Whether you are a project management guru or just a beginner, you’ve definitely heard about Gantt charts. At first sight, these diagrams might seem chilling and complicated, however, they are not as mystifying as you may think.
Gantt Charts assist project managers and their teams to improve their productivity and efficiency of workflows and ensure timely tasks execution. The charts can be applied to small projects and the most complex ones. What are the secrets of the diagrams developed by Henry Gantt and what people in project management used before they were created?
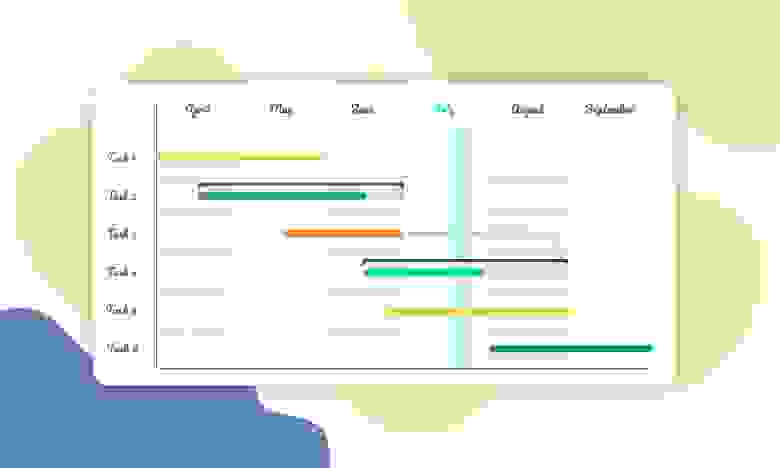
A Gantt Chart is a visual way to display scheduled tasks that illustrates the course of an entire project and all its parts. This kind of horizontal graphic is widely used for planning projects of any size in different industries. The charts are pretty convenient to show what work is planned to be done on a specific day and time. They also help teams and project managers to track the start and end dates of any project. All in one space.
Henry Gantt was the person who described these bar diagrams. There is an opinion that the initial idea of project planning with the using of horizontal histograms came to him as well.
Another point of view refers to the Polish engineer Karol Adamiecki, as the first person who linked such diagrams to the project activity in 1896.
Adamiecki proposed the own idea of visualizing processes and progress to make it easier to view and record production schedules. The major part of his researches was related to the steel industry. The initial name for the chart was “harmonogram".
The engineer published the articles about his “discovery” in Polish and Russian languages. That was the reason why his idea with the charts was not widely used in the world.
Henry Gantt independently came to the same idea about 15 years later. He started visual planning with histograms in 1910 to communicate supervisors if production was successful or out of schedule. Thus, the name Gantt Charts took its roots.
Before starting to use handy Gantt diagrams, project managers simply planned their projects on paper. Some enthusiasts act this way nowadays.
Fortunately, now you can apply any convenient and user-friendly project management tool that often allow Gantt charts as a basis for the visual project displaying.
Gantt diagrams will help you to see and monitor the dates when your projects' begin and end, tasks the project includes, tasks duration, the ways to combine tasks, how long each task takes, and who is working on a particular task.
The best thing about Gantt charts is that they can help almost anyone who aims to visualize their tasks. The most complex processes are performed by computer algorithms nowadays, so anyone can easily build a simple task list with starts and ends.
Gantt Charts are commonly used by:
Stereotypically, people think that Gantt diagrams are basically used in the IT-sphere. That's partially right, as most often diagrams are used in software development.
However, you may implement Gantt charts into various areas for almost any project in:
The simplest Gantt Chart can be created on a piece of paper, as it was mentioned above.
These charts will help you to find a critical path, prioritize and apply a work breakdown structure (WBS).
If you manage a large project that includes many tasks, be sure to install all the dependencies correctly. In the other case, something complicated will turn out.
If required, you may share projects with your team members. And that's it! The only thing you left to do is to analyze the results.
You may create a simple Gantt chart using Excel that helps companies around the world to visualize and track projects of various sizes.
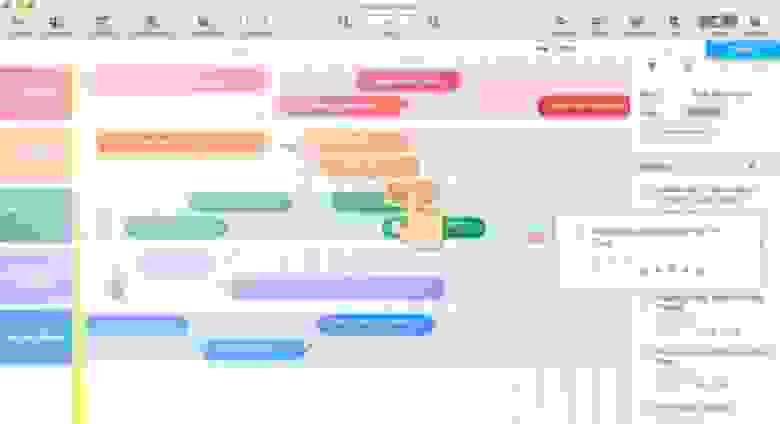
Luckily, project managers have found once that they could save their resources and time to create and update Gantt bars with the help of smart online tools. Gantt Chart-focused software is designed to plan projects and manage them completely. Such services are created to automate business processes, create task dependencies, define critical paths, add steps, and so on.
Their essential features usually include tasks section, setting progress, subtasks, milestones, dependencies, using custom colors, etc.
You may use a local program, for example, Microsoft Project, or try any powerful project management software with the Gantt chart feature. This online solution will simplify project scheduling and sharing, it will be available for any team member. You'll easily schedule tasks, track their statuses, update, and attach files.
Here are some successful online solutions that are focused on Gantt charts:

If we recall the key responsibilities of product managers and project managers, we'll find that the use of diagrams can often be seen in online roadmaps.
→ Hygger Roadmap
→ Roadmunk Roadmap
→ Roadmap Planner
→ Wizeline Roadmap
It'd be a quite natural question to ask if it is safe to use software with Gantt charts?
Most companies offer strong software protection and encryption and have strict security protocols to protect data, so this wouldn't be a problem.
To sum it up, let's highlight the key advantages of Gantt Charts and professional software with this feature:
How often do you use Gantt Charts and what for? What software is worth to be applied to create online Gantt charts? Feel free to share your thoughts.
Gantt Charts assist project managers and their teams to improve their productivity and efficiency of workflows and ensure timely tasks execution. The charts can be applied to small projects and the most complex ones. What are the secrets of the diagrams developed by Henry Gantt and what people in project management used before they were created?

Gantt Charts introduction: what are they for?
A Gantt Chart is a visual way to display scheduled tasks that illustrates the course of an entire project and all its parts. This kind of horizontal graphic is widely used for planning projects of any size in different industries. The charts are pretty convenient to show what work is planned to be done on a specific day and time. They also help teams and project managers to track the start and end dates of any project. All in one space.
Where are the roots?
Henry Gantt was the person who described these bar diagrams. There is an opinion that the initial idea of project planning with the using of horizontal histograms came to him as well.
Another point of view refers to the Polish engineer Karol Adamiecki, as the first person who linked such diagrams to the project activity in 1896.
Adamiecki proposed the own idea of visualizing processes and progress to make it easier to view and record production schedules. The major part of his researches was related to the steel industry. The initial name for the chart was “harmonogram".
The engineer published the articles about his “discovery” in Polish and Russian languages. That was the reason why his idea with the charts was not widely used in the world.
Henry Gantt independently came to the same idea about 15 years later. He started visual planning with histograms in 1910 to communicate supervisors if production was successful or out of schedule. Thus, the name Gantt Charts took its roots.
Before starting to use handy Gantt diagrams, project managers simply planned their projects on paper. Some enthusiasts act this way nowadays.
Fortunately, now you can apply any convenient and user-friendly project management tool that often allow Gantt charts as a basis for the visual project displaying.
What can be tracked with the help of Gantt charts?
Gantt diagrams will help you to see and monitor the dates when your projects' begin and end, tasks the project includes, tasks duration, the ways to combine tasks, how long each task takes, and who is working on a particular task.
Key benefits of Gantt charts in project management
- Allow you to be aware of what is going on in your projects
- Improve communication and increase team cohesion
- Measure projects' progress
- Assist to avoid resource overloading
- Demonstrate overlapping activities and task dependencies
- Provide better time management
- 7Add more clarity
- Motivate remote team members
- Boost flexibility
- Promote transparency
Who can use Gantt Сharts?
The best thing about Gantt charts is that they can help almost anyone who aims to visualize their tasks. The most complex processes are performed by computer algorithms nowadays, so anyone can easily build a simple task list with starts and ends.
Gantt Charts are commonly used by:
- Top managers
- Product Owners
- Team leads
- Project managers
- Product managers
- Marketers
- Account managers
- Business analysts
- Operational managers and so on.
Stereotypically, people think that Gantt diagrams are basically used in the IT-sphere. That's partially right, as most often diagrams are used in software development.
However, you may implement Gantt charts into various areas for almost any project in:
- IT
- marketing
- construction
- consulting agencies
- financial institutions and banks
- human resources
- education
- insurance
- healthcare
- architecture
- events, etc.
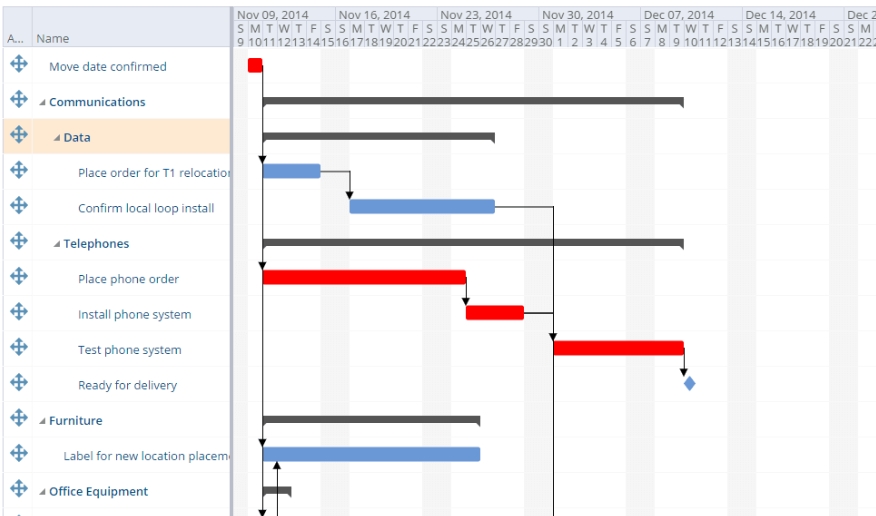
How do I build a simple Gantt Chart?
The simplest Gantt Chart can be created on a piece of paper, as it was mentioned above.
- You've to combine all your tasks in a list.
- Mark the start date and highlight estimated duration for every task.
- Draw diagrams and horizontal bars. Divide the division into days/weeks.
- Place your tasks on graphic blocks and identify early start dates.
- Set the time required to complete them. Determine the schedule. All dependent activities should not start until the tasks on which they depend are completed.
These charts will help you to find a critical path, prioritize and apply a work breakdown structure (WBS).
If you manage a large project that includes many tasks, be sure to install all the dependencies correctly. In the other case, something complicated will turn out.
If required, you may share projects with your team members. And that's it! The only thing you left to do is to analyze the results.
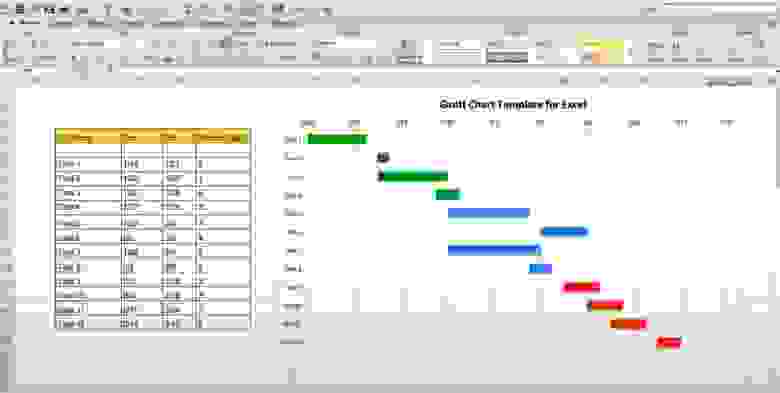
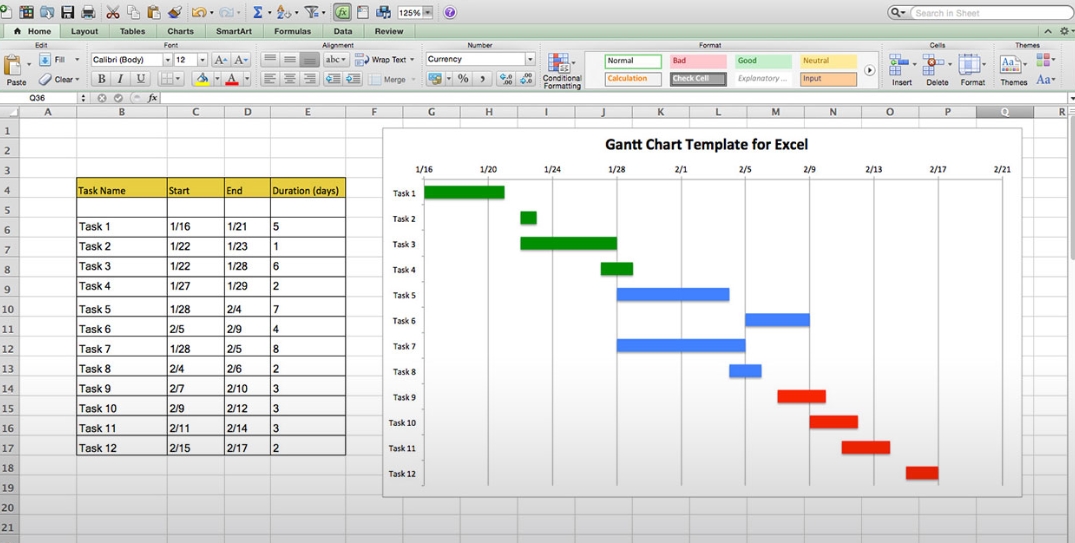
Gantt Charts and Excel
You may create a simple Gantt chart using Excel that helps companies around the world to visualize and track projects of various sizes.
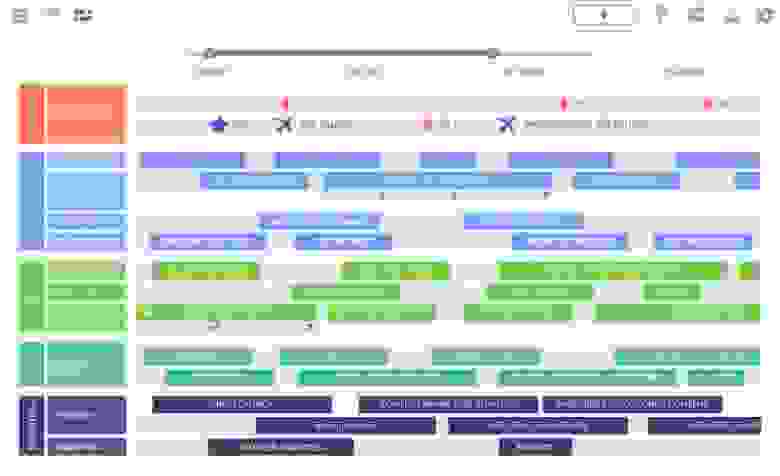
Gantt Charts software
Luckily, project managers have found once that they could save their resources and time to create and update Gantt bars with the help of smart online tools. Gantt Chart-focused software is designed to plan projects and manage them completely. Such services are created to automate business processes, create task dependencies, define critical paths, add steps, and so on.
Their essential features usually include tasks section, setting progress, subtasks, milestones, dependencies, using custom colors, etc.
You may use a local program, for example, Microsoft Project, or try any powerful project management software with the Gantt chart feature. This online solution will simplify project scheduling and sharing, it will be available for any team member. You'll easily schedule tasks, track their statuses, update, and attach files.
Here are some successful online solutions that are focused on Gantt charts:
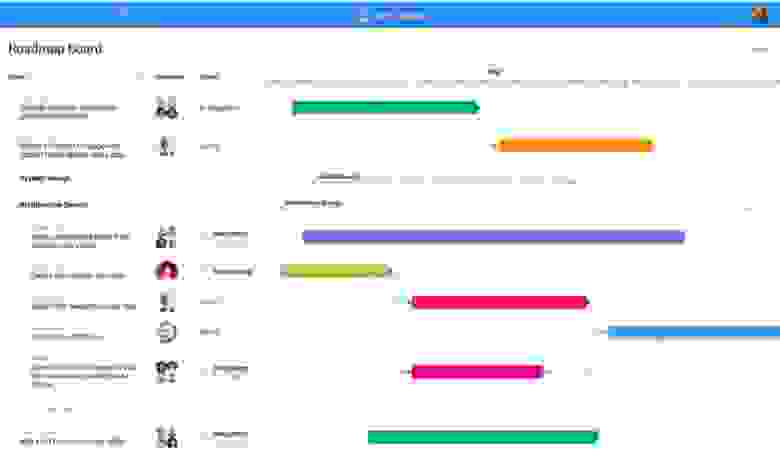
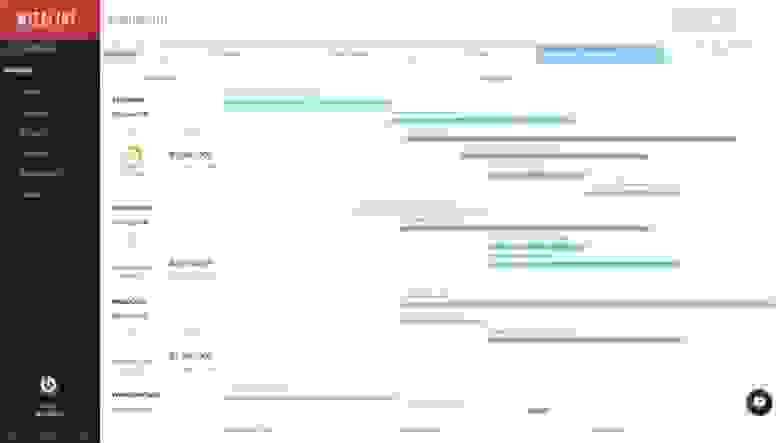
If we recall the key responsibilities of product managers and project managers, we'll find that the use of diagrams can often be seen in online roadmaps.
→ Hygger Roadmap

→ Roadmunk Roadmap

→ Roadmap Planner

→ Wizeline Roadmap

Final thoughts
It'd be a quite natural question to ask if it is safe to use software with Gantt charts?
Most companies offer strong software protection and encryption and have strict security protocols to protect data, so this wouldn't be a problem.
To sum it up, let's highlight the key advantages of Gantt Charts and professional software with this feature:
- Visualizes tasks and all project phases
- Helps to identify critical points
- Optimizes planning and task distribution
- Can be easily updated
- Can even be created on paper or in Excel
How often do you use Gantt Charts and what for? What software is worth to be applied to create online Gantt charts? Feel free to share your thoughts.
