In our previous article, we discussed the reasons of unit-tests’ instability and how to make them stable. Now let’s look through a new tools for debugging and profiling which were introduced by Apple in iOS 12 — the framework os_log and instrument for performance analysis os_signpost.

In one of the sprints, we were tasked with implementing the generation of a pdf-document on the client-side. We completed the task. But we wanted to make sure the effectiveness of the technical nuances of the decision. Signpost helped us with this. Using it we increased he document’s displaying speed several times.
To learn more about os_signpost application technology, see where it can help you and how it has already helped us, go further forward.
There are lot of applications on the user's mobile device, and all of them use common system resources, such as: CPU, RAM, network, battery, etc. If your application performs its tasks and does not crash, it doesn’t mean that it works efficiently and correctly.
Below we describe the cases that you may potentially encounter.
The specifications for the phones on the Apple website do not provide information on RAM, but other sources provide the following memory allocation for phone models:
To verify the correctness of processing the described cases, we suggest using os_signpost to profile the application processes and then analyze the data obtained.
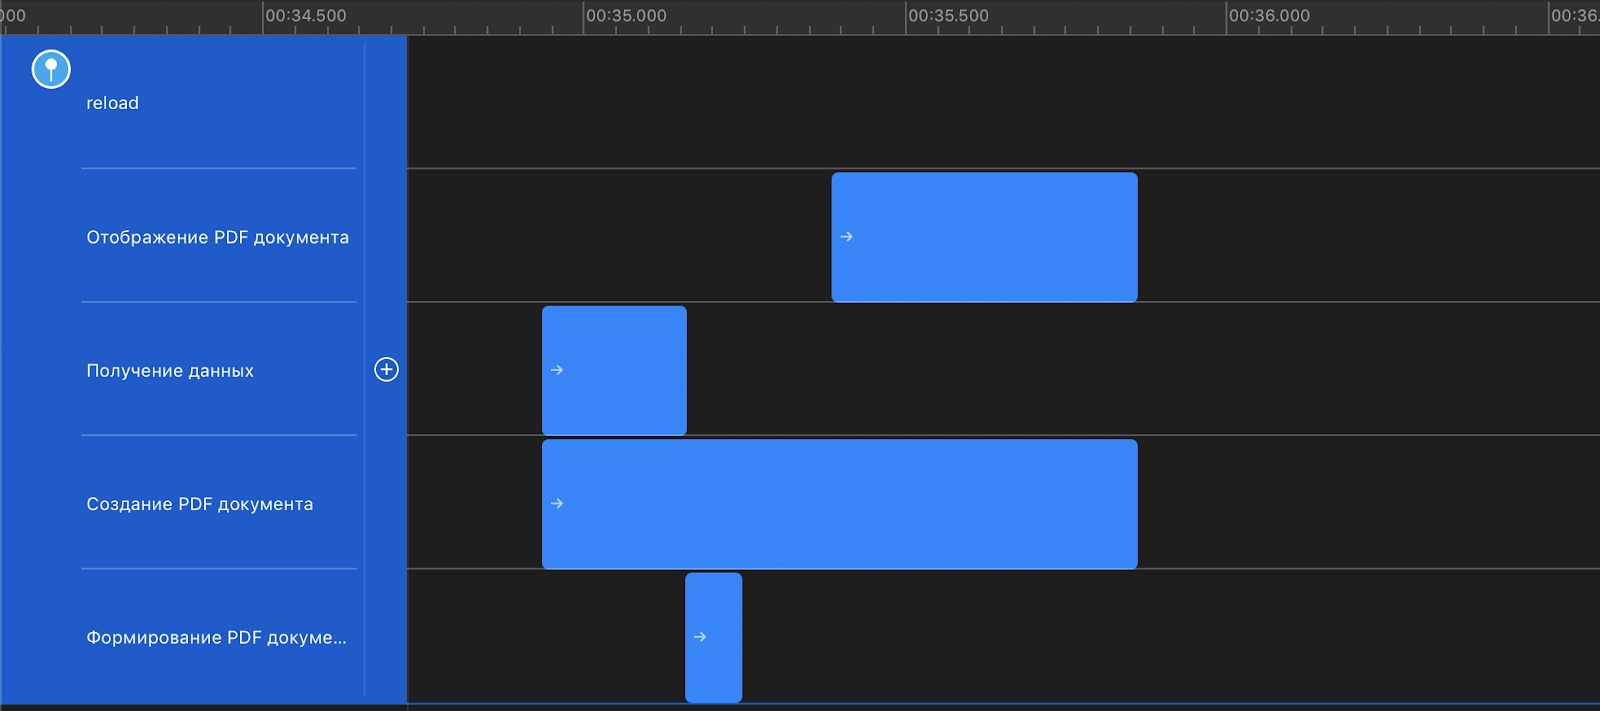
At the top level, the process of creating a PDF consists of three steps:
We decided to split and log the stages of document generation, starting from the user clicking the «Generate» button and ending with the display of the document on the screen.
Suppose we are faced with the task of analyzing an asynchronous network request. The markup in the code will look like this:
Steps for using signpost are as follows:
Similarly on obj-c:
Note that if the project should run on iOS prior to version 12.0, Xcode will offer to wrap os_signpost calls in the if #available construct. In order not to clutter up the code, you can put this logic in a separate class.
It is worth considering that os_signpost requires a static string literal as the parameter of the event name. To add more stringent typing, you can create an enum with event types, and in the class implementation, map them to string literals. Putting OSLog in a separate class will add the logic to disable it for the release scheme (there is a separate OSLog command for this).
You can add values from any properties to the event marking with the following type decoders for convenient formatting:
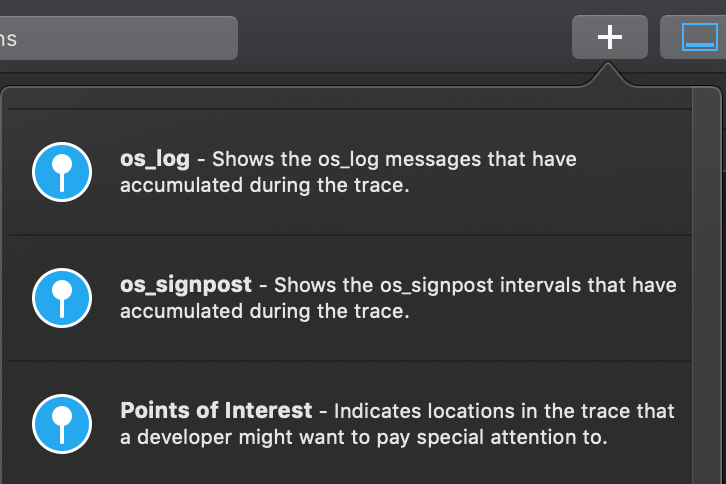
Now, when profiling the application, events from os_signpost will be sent to Instruments in the form of tabular data. To switch to tools, use the keyboard shortcut Cmd + I, then select the tool necessary for profiling. To see the marked data, just turn on the os_signpost and Point of Interest tools on the right side of the tool interface.
By default, events are grouped into categories and displayed in a table, where their number and statistics on runtime are calculated. Additionally, there is a graphical display on the timeline, which makes it easy to compare the received events with the results in other tools. There is also the possibility of customizing the display of statistics and writing expert systems — but this topic deserves a separate article.
Through the use of os_signpost, we saw that for small documents (a couple of pages) the longest step was the last step — displaying the document — rather than working with a network or graphics. This led us to the decision to replace WKWebView with PDFView, which accelerated the display of the document from 1.5 seconds to 30 milliseconds. On the graphs, it looks like this:
Rendering PDF document (WKWebView) in time profiler.
Rendering PDF document (PDFView) in time profiler.
The resulting data can be implemented in other tools that Xcode provides. As the Allocations tool showed, the gain in download speed was achieved by increasing the use of RAM.
A PDF document generates asynchronously, and its formation requires the allocation of a significant amount of memory. In case of insufficient memory, we decided to add the ability to stop the asynchronous operation of creating a document.
As you know, when using NSOperationQueue, the cancelAllOperation method frees an existing queue but does not stop already running operations. From this, we conclude that in the implementation of the operation it is necessary to periodically determine its condition and stop working. Thus freeing up resources if it is set to Canceled status.
The next step is an asynchronous operation that we need to check for cancellation. But at the same time, it is not clear with what frequency to do this check. We had two options — line-by-line checking and page-by-page checking. os_signpost helped here too. As it turned out, adding a check for cancellation in the line-by-line cycle of rendering the table in the document, we increased the time it took to generate the document (by 150 pages) by 2 times. The second option was more optimal in terms of performance and actually did not increase the time it took to create the document. As a result, when we receive the memory warning event, we cancel the operation programmatically and display the error screen for the user.
To make sure that memory is indeed freed, we can also use os_signpost. This time, by adding a marker about the start of the event in the didRecieveMemoryWarning method and a marker about the end of the error screen in viewDidLoad. By the way, you can emulate an insufficient memory event in the simulator (shift + command + m).
Signpost may be useful in the layout process. To create constraints, we use the masonry framework. The documentation for the framework says that it is recommended to use the updateConstraints () method to create constrates. But Apple strongly discourages doing so, and you can verify this with signpost markup.
According to Apple's documentation, updateConstraints should only be used to change constraints if we cannot do it at the place the change occurred.
After analyzing the results, we concluded that in our application the updateConstraints call is not so frequent — approximately every time the view appears on the screen. Despite this, in order to avoid potential performance defects, we recommend following Apple's advice on this.
In 2018, Apple provided developers with the opportunity to independently expand profiling tools. Of course, you can use other debugging tools: breakpoints, output to the console, timers, custom profilers. But it takes more time to implement or do not always give a complete picture of what is happening.
In the next article, we will consider how to use the information received from signpost more efficiently by writing our own expert system (Custom Instruments).
Article was written with victoriaqb — Victoria Kashlina, iOS-developer.

In one of the sprints, we were tasked with implementing the generation of a pdf-document on the client-side. We completed the task. But we wanted to make sure the effectiveness of the technical nuances of the decision. Signpost helped us with this. Using it we increased he document’s displaying speed several times.
To learn more about os_signpost application technology, see where it can help you and how it has already helped us, go further forward.
Deepdive
There are lot of applications on the user's mobile device, and all of them use common system resources, such as: CPU, RAM, network, battery, etc. If your application performs its tasks and does not crash, it doesn’t mean that it works efficiently and correctly.
Below we describe the cases that you may potentially encounter.
Suboptimal algorithm can lead to a long CPU load
- At the start of the application, after 20 seconds of waiting, the system will shut down the application, and the user will not even see the app's first screen. In this case, the system will set a crash report, the distinguishing feature of which will be an exception type — EXC_CRASH (SIGKILL), type 0x8badf00d.
- Resource-intensive processes in the background thread can affect the responsiveness of the UI, increase battery consumption and force the application to terminate the system (in case of prolonged CPU overheating).
Low RAM
The specifications for the phones on the Apple website do not provide information on RAM, but other sources provide the following memory allocation for phone models:
| Type |
4S |
5 |
5C |
5S |
6 |
6P |
6S |
6SP |
| RAM, Gb |
0.5 |
1 |
1 |
1 |
1 |
1 |
2 |
2 |
| Type |
SE |
X |
7 |
7P |
8 |
8P |
XS |
XSM |
XR |
| RAM, Gb |
2 |
3 |
2 |
3 |
2 |
3 |
4 |
4 |
3 |
- When there is too little free RAM, iOS starts looking for memory to free up, simultaneously sending a memory warning to all running applications. This process implicitly affects the CPU and battery of the device. If the memory warning is ignored, and the allocation of memory continues, the system forcibly terminates the application process. For the user, this looks like crash, with no backtraces in the crash report.
- Excessive use of network requests. This also leads to a battery-life decreasing. Duplication of requests and / or lack of cancellation of unnecessary requests additionally leads to inefficient use of the CPU.
- Do not forget about CoreLocation. The more often and more accurately we request the user's location, the more the device’s battery is spent.
To verify the correctness of processing the described cases, we suggest using os_signpost to profile the application processes and then analyze the data obtained.
OSLog integration in the project
At the top level, the process of creating a PDF consists of three steps:
- Receiving data over the network;
- Document formation;
- Document displaying on the screen
We decided to split and log the stages of document generation, starting from the user clicking the «Generate» button and ending with the display of the document on the screen.
Suppose we are faced with the task of analyzing an asynchronous network request. The markup in the code will look like this:
import os.signpost

let pointsOfInterestLog = OSLog(subsystem: "com.example.your-app", category: . pointsOfInterest)
let networkLog = OSLog(subsystem: "com.example.your-app", category: "NetworkOperations")

os_signpost(.event, log: pointsOfInterestLog, name: "Start work")
os_signpost(.begin, log: networkLog, name: "Overall work")

for element in elements {
    os_signpost(.begin, log: networkLog, name: "Element work")
    makeWork(for: element)
    os_signpost(.end, log: networkLog, name: "Element work")
}

os_signpost(.end, log: networkLog, name: "Overall work")
Steps for using signpost are as follows:
- Import the os.signpost framework.
- Create an instance of OSLog. It is worth considering that there are several types of events: for interval events (for example, a network request), you can use an arbitrary category, and for simultaneous events (for example, clicking a button), the predefined category pointsOfInterest / OS_LOG_CATEGORY_POINTS_OF_INTEREST.
- For interval events, call the os_signpost function with the .begin and .end type at the beginning and at the end of the stage under investigation. For simultaneous events, use the .event type.
- If the code can be executed asynchronously, then add a Signpost ID, which will allow you to separate the intervals of the same type of operations with different objects.
- Optionally, you can add additional data (metadata) to dispatched events. For example, the size of the images downloaded or the number of the generated PDF page. Such information will help to understand what exactly happens in the investigated stage of code execution.
Similarly on obj-c:
@import os.signpost;

os_log_t pointsOfInterestLog = os_log_create("com.example.your-app",   OS_LOG_CATEGORY_POINTS_OF_INTEREST);
os_log_t networkLog = os_log_create("com.example.your-app",   "NetworkOperations");
os_signpost_id_t operationIdentifier = os_signpost_id_generate(networkLog);

os_signpost_event_emit(pointsOfInterestLog, operationIdentifier, "Start work");
os_signpost_interval_begin(networkLog, operationIdentifier, "Overall work");

for element in elements {
    os_signpost_id_t elementIdentifier = os_signpost_id_make_with_pointer(networkLog, element);
    os_signpost_interval_begin(networkLog, elementIdentifier, "Element work");
    [element makeWork];
    os_signpost_interval_end(networkLog, elementIdentifier, "Element work");
}

os_signpost_interval_end(networkLog, operationIdentifier, "Overall work");
Note that if the project should run on iOS prior to version 12.0, Xcode will offer to wrap os_signpost calls in the if #available construct. In order not to clutter up the code, you can put this logic in a separate class.
It is worth considering that os_signpost requires a static string literal as the parameter of the event name. To add more stringent typing, you can create an enum with event types, and in the class implementation, map them to string literals. Putting OSLog in a separate class will add the logic to disable it for the release scheme (there is a separate OSLog command for this).
import os.signpost

let networkLog: OSLog

if ProcessInfo.processInfo.environment.keys.contains("SIGNPOSTS_FOR_NETWORK") {
    networkLog = OSLog(subsystem: "com.example.your-app", category: "NetworkOperations"
} else {
    networkLog = .disabled
}
You can add values from any properties to the event marking with the following type decoders for convenient formatting:
| Value type |
Custom specifier |
Example output |
| time_t |
%{time_t}d |
2016-01-12 19:41:37 |
| timeval |
%{timeval}.*P |
2016-01-12 19:41:37.774236 |
| timespec |
%{timespec}.*P |
2016-01-12 19:41:37.2382382823 |
| errno |
%{errno}d |
Broken pipe |
| iec-bytes |
%{iec-bytes}d |
2.64 MiB |
| bitrate |
%{bitrate}d |
123 kbps |
| iec-bitrate |
%{iec-bitrate}d |
118 Kibps |
| uuid_t |
%{uuid_t}.*16P %{uuid_t}.*P |
10742E39-0657-41F8-AB99-878C5EC2DCAA |
Now, when profiling the application, events from os_signpost will be sent to Instruments in the form of tabular data. To switch to tools, use the keyboard shortcut Cmd + I, then select the tool necessary for profiling. To see the marked data, just turn on the os_signpost and Point of Interest tools on the right side of the tool interface.
By default, events are grouped into categories and displayed in a table, where their number and statistics on runtime are calculated. Additionally, there is a graphical display on the timeline, which makes it easy to compare the received events with the results in other tools. There is also the possibility of customizing the display of statistics and writing expert systems — but this topic deserves a separate article.
Examples of using
Case #1. PDFKit vs WKWebView
Through the use of os_signpost, we saw that for small documents (a couple of pages) the longest step was the last step — displaying the document — rather than working with a network or graphics. This led us to the decision to replace WKWebView with PDFView, which accelerated the display of the document from 1.5 seconds to 30 milliseconds. On the graphs, it looks like this:
Rendering PDF document (WKWebView) in time profiler.

Rendering PDF document (PDFView) in time profiler.
The resulting data can be implemented in other tools that Xcode provides. As the Allocations tool showed, the gain in download speed was achieved by increasing the use of RAM.
Case #2 LowMemory Warning
A PDF document generates asynchronously, and its formation requires the allocation of a significant amount of memory. In case of insufficient memory, we decided to add the ability to stop the asynchronous operation of creating a document.
As you know, when using NSOperationQueue, the cancelAllOperation method frees an existing queue but does not stop already running operations. From this, we conclude that in the implementation of the operation it is necessary to periodically determine its condition and stop working. Thus freeing up resources if it is set to Canceled status.
The next step is an asynchronous operation that we need to check for cancellation. But at the same time, it is not clear with what frequency to do this check. We had two options — line-by-line checking and page-by-page checking. os_signpost helped here too. As it turned out, adding a check for cancellation in the line-by-line cycle of rendering the table in the document, we increased the time it took to generate the document (by 150 pages) by 2 times. The second option was more optimal in terms of performance and actually did not increase the time it took to create the document. As a result, when we receive the memory warning event, we cancel the operation programmatically and display the error screen for the user.
To make sure that memory is indeed freed, we can also use os_signpost. This time, by adding a marker about the start of the event in the didRecieveMemoryWarning method and a marker about the end of the error screen in viewDidLoad. By the way, you can emulate an insufficient memory event in the simulator (shift + command + m).
Case #3. Update Constraints
Signpost may be useful in the layout process. To create constraints, we use the masonry framework. The documentation for the framework says that it is recommended to use the updateConstraints () method to create constrates. But Apple strongly discourages doing so, and you can verify this with signpost markup.

According to Apple's documentation, updateConstraints should only be used to change constraints if we cannot do it at the place the change occurred.
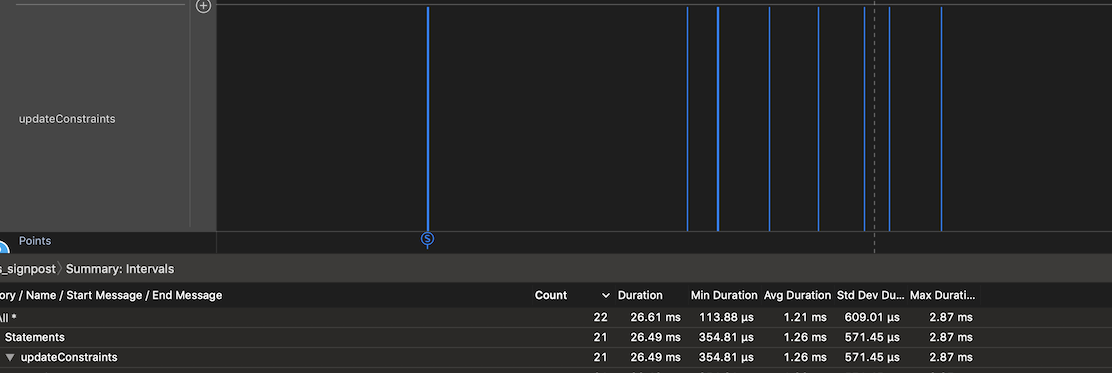
After analyzing the results, we concluded that in our application the updateConstraints call is not so frequent — approximately every time the view appears on the screen. Despite this, in order to avoid potential performance defects, we recommend following Apple's advice on this.
Summary
In 2018, Apple provided developers with the opportunity to independently expand profiling tools. Of course, you can use other debugging tools: breakpoints, output to the console, timers, custom profilers. But it takes more time to implement or do not always give a complete picture of what is happening.
In the next article, we will consider how to use the information received from signpost more efficiently by writing our own expert system (Custom Instruments).
Useful links
- Measuring Performance Using Logging (WWDC)
- Creating Custom Instruments (WWDC)
- What’s New in Energy Debugging (WWDC)
- iOS Memory Deep Dive (WWDC)
- Practical Approaches to Great App Performance (WWDC)
- High Performance Auto Layout (WWDC)
- Understanding and Analyzing Application Crash Reports
- Logging
- List of iOS devices
- Using Signposts for Performance Tuning on iOS
- Getting started with signposts
- os_signpost API 尝鲜
Article was written with victoriaqb — Victoria Kashlina, iOS-developer.
