Even most of the experienced Ruby on Rails developers sometimes forgot about annoying mistakes they produce in the long development processes, like n+1 queries or lose a lot of time with some unexpected queries from nowhere.
Not all these mistakes can be avoided before the production, but at least you can try :)
Yes, that’s another list of forgotten or not so popular gems for the better development processes.
Let’s begin.
Bullet — one of the most popular and easiest solutions for fighting with n+1 queries.
This gem provides different ways to show you that some queries are not efficient. Browser (console log), development log, output file. My choice is just to use a development log because it’s not so annoying (some problems are showing just not in time or could not be resolved easily with current architecture).
How it works: you have, for example, index request for some model (services). And this model has many different relations (services has_many groups), they have relations too..(groups has_many users, users has_many logos, etc). And it can cause repeated inefficient loading of data (n+1). You want to show logo_url and it just start creating unnecessary queries for every user (sometimes you see it immediately, sometimes it’s not so clear). In most of the cases bullet will throw next lines in your dev logs:
As you can see, it shows request, what was found (eager loading), model and what exactly loaded multiple times. And call stack, of course.
Good enough start!
Bullet can find unused eager loading and counter caches. And allows you to disable any of its detectors.
In my projects, I prefer to disable unused eager loading queries because it’s a common situation when one loading model service used in many places, and for different places, you don’t need to preload some relations which is clearly needed in some other places. And this situation is very annoying in the end. You better preload some info then forget to load it correctly somewhere.
My config (in development.rb):
More info:
active_record_query_trace — a gem that logs/displays a backtrace of all SQL queries executed by Active Record
(I just copied the part of the description from their Github page because they have all you need to know )
Displays a backtrace for each query in Rails’ development console and log. Allows you to track down where queries are executed in your application. Useful for performance optimizations and for finding where to start when making changes to a large application.
When enabled, every query will be logged like:
From my side want to say, that this gem is very useful when you start working on the project not from the beginning and cannot know how everything is working (or just with colleagues features), and some query calls are not easily understandable. It could save a lot of time, really.
Also a little note:
For every ActiveRecord query there will be one additional backtrace in the log file. By default, it’s 5, which is big enough to make your logs fully unreadable.
But it can be controlled:
More info:
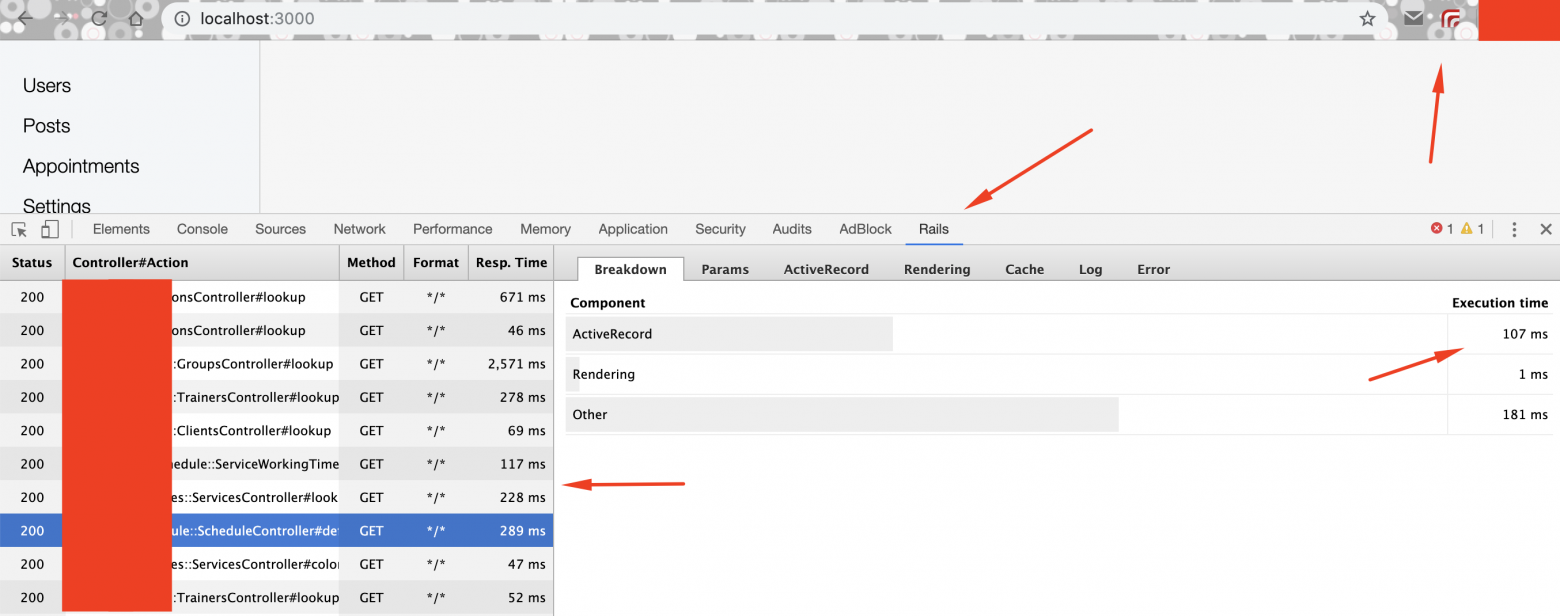
RailsPanel is a Chrome extension for Rails development that will end your tailing of development.log. Have all information about your Rails app requests in the browser — in the Developer Tools panel. Provides insight to db/rendering/total times, parameter list, rendered views and more.
To use this extension you need to add meta_request gem to your app’s Gemfile:
Install RailsPanel extension from the Chrome WebStore. This is the recommended way of installing extension, since it will auto-update on every new version.
This is the example of enabled rails_panel gem/extension:
More info:
After installing the gem and opening your project you will see the popup in the left upper corner (can be re-configured) on the page:
After clicking on it you will see more detailed info:
As you can see, here is a lot of useful info for more efficient work. Also, it works with SPA applications.
More info:
New Relic is a performance management system, developed by New Relic, Inc. It provides you with deep information about the performance of your Rails or Ruby application as it runs in production and transmits them to newrelic.com where you can monitor them in real-time. (ALSO THEY HAVE NO-PAID ACCOUNT)
Datadog as an alternative is also a very good choice. They provide the same functionality as New Relic. Just check their possibilities, user interface, prices and choose whatever you prefer.
More info:
Thanks for reading!
Not all these mistakes can be avoided before the production, but at least you can try :)
Yes, that’s another list of forgotten or not so popular gems for the better development processes.
Let’s begin.
1. Bullet
Bullet — one of the most popular and easiest solutions for fighting with n+1 queries.
This gem provides different ways to show you that some queries are not efficient. Browser (console log), development log, output file. My choice is just to use a development log because it’s not so annoying (some problems are showing just not in time or could not be resolved easily with current architecture).
How it works: you have, for example, index request for some model (services). And this model has many different relations (services has_many groups), they have relations too..(groups has_many users, users has_many logos, etc). And it can cause repeated inefficient loading of data (n+1). You want to show logo_url and it just start creating unnecessary queries for every user (sometimes you see it immediately, sometimes it’s not so clear). In most of the cases bullet will throw next lines in your dev logs:
GET /api/services
USE eager loading detected
Service => [:groups]
Add to your finder: :includes => [:groups]
Call stack
/home/projects/test_app_name/app/services/index.rb:18:in `perform'
/home/projects/test_app_name/app/controllers/services_controller.rb:7:in `index'
As you can see, it shows request, what was found (eager loading), model and what exactly loaded multiple times. And call stack, of course.
Good enough start!
Bullet can find unused eager loading and counter caches. And allows you to disable any of its detectors.
# Each of these settings defaults to true

# Detect N+1 queries
Bullet.n_plus_one_query_enable = false

# Detect eager-loaded associations which are not used Bullet.unused_eager_loading_enable = false
# Detect unnecessary COUNT queries which could be avoided
# with a counter_cache
Bullet.counter_cache_enable = false
In my projects, I prefer to disable unused eager loading queries because it’s a common situation when one loading model service used in many places, and for different places, you don’t need to preload some relations which is clearly needed in some other places. And this situation is very annoying in the end. You better preload some info then forget to load it correctly somewhere.
My config (in development.rb):
config.after_initialize do
  Bullet.enable = true
  Bullet.rails_logger = true
  Bullet.unused_eager_loading_enable = false
end
More info:
- github.com/flyerhzm/bullet
- evilmartians.com/chronicles/fighting-the-hydra-of-n-plus-one-queries
- semaphoreci.com/blog/2017/08/09/faster-rails-eliminating-n-plus-one-queries.html
- blog.appsignal.com/2018/04/24/active-record-performance-the-n+1-queries-antipattern.html
2. ActiveRecordQueryTrace (active_record_query_trace)
active_record_query_trace — a gem that logs/displays a backtrace of all SQL queries executed by Active Record
(I just copied the part of the description from their Github page because they have all you need to know )
Displays a backtrace for each query in Rails’ development console and log. Allows you to track down where queries are executed in your application. Useful for performance optimizations and for finding where to start when making changes to a large application.
When enabled, every query will be logged like:
Started GET "/" for 172.19.0.1 at 2019-09-29 07:08:04 +0000
Processing by HomeController#index as HTML
  Users::User Load (1.7ms)  SELECT  `users`.* FROM `users` WHERE `users`.`id` = 10014 LIMIT 1
Query Trace:
  app/controllers/concerns/user_stack.rb:44:in `peek'
Clubs::Club Load (1.7ms)  SELECT  `clubs`.* FROM `clubs` WHERE `clubs`.`id` = 15 LIMIT 1
Query Trace:
  app/controllers/concerns/user_aware.rb:38:in `current_club'
From my side want to say, that this gem is very useful when you start working on the project not from the beginning and cannot know how everything is working (or just with colleagues features), and some query calls are not easily understandable. It could save a lot of time, really.
Also a little note:
For every ActiveRecord query there will be one additional backtrace in the log file. By default, it’s 5, which is big enough to make your logs fully unreadable.
But it can be controlled:
ActiveRecordQueryTrace.lines = 1 # or 2, something not bigMore info:
- github.com/brunofacca/active-record-query-trace
- evilmartians.com/chronicles/rails-query-optimizations
3. rails_panel
RailsPanel is a Chrome extension for Rails development that will end your tailing of development.log. Have all information about your Rails app requests in the browser — in the Developer Tools panel. Provides insight to db/rendering/total times, parameter list, rendered views and more.
To use this extension you need to add meta_request gem to your app’s Gemfile:
group :development do
  gem 'meta_request'
end
Install RailsPanel extension from the Chrome WebStore. This is the recommended way of installing extension, since it will auto-update on every new version.
This is the example of enabled rails_panel gem/extension:

More info:
4. rack-mini-profiler
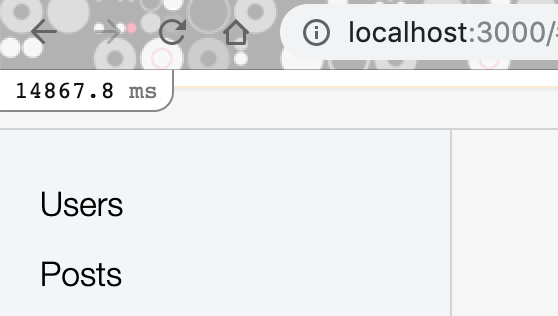
After installing the gem and opening your project you will see the popup in the left upper corner (can be re-configured) on the page:

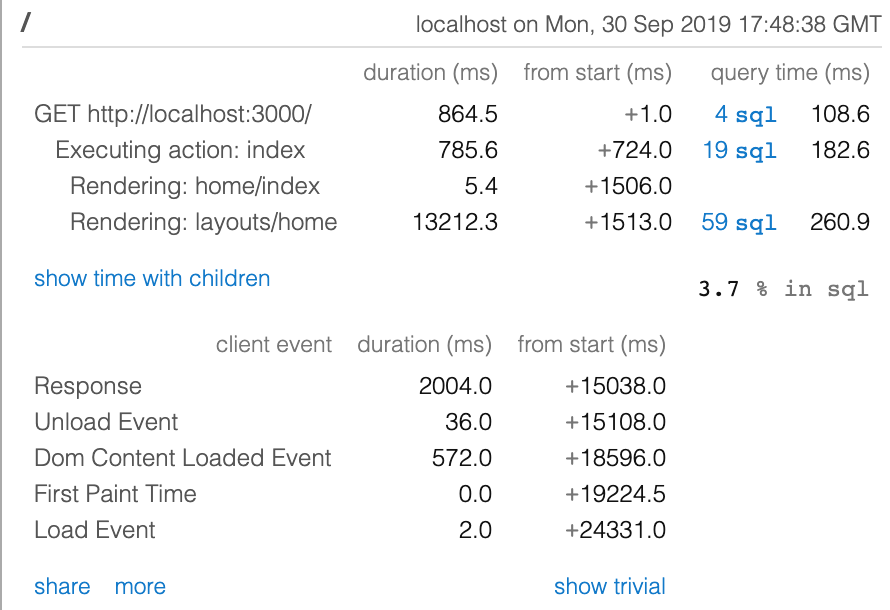
After clicking on it you will see more detailed info:

As you can see, here is a lot of useful info for more efficient work. Also, it works with SPA applications.
More info:
- github.com/MiniProfiler/rack-mini-profiler
- www.codementor.io/victor_hazbun/rack-mini-profiler-for-the-win-kq00prump
- stackify.com/rack-mini-profiler-a-complete-guide-on-rails-performance
5. newrelic / datadog
New Relic is a performance management system, developed by New Relic, Inc. It provides you with deep information about the performance of your Rails or Ruby application as it runs in production and transmits them to newrelic.com where you can monitor them in real-time. (ALSO THEY HAVE NO-PAID ACCOUNT)
Datadog as an alternative is also a very good choice. They provide the same functionality as New Relic. Just check their possibilities, user interface, prices and choose whatever you prefer.
More info:
- stackshare.io/stackups/datadog-vs-new-relic
- www.upguard.com/articles/datadog-vs-newrelic
- docs.newrelic.com/docs/agents/ruby-agent/installation/install-new-relic-ruby-agent
- railsware.com/blog/use-new-relic-like-a-pro
- www.datadoghq.com/blog/monitoring-rails-with-datadog
- josh.works/data-dog-apm-rails-app-setup
Thanks for reading!
