Предлагаю к прочтению свободный перевод небольшой статьи по практическому применению GraphQL. Оригинал доступен по ссылке (En).
GraphQL это язык запросов для API, который предлагает декларативный подход к получению данных. Он позволяет клиентам запрашивать только нужные данные с веб-сервера и ничего лишнего. Разработанный еще в 2012 году Facebook’ом, которым по-прежнему и поддерживается, GraphQL стал использоваться многими другими крупными и не очень компаниями. Среди прочих Yelp, Shopify и Github.
При использовании REST APIs обычно запросы отправляются по нескольким адресам, для получения всех необходимых данных в приложении. GraphQL API же позволяет тебе отправлять все запрос по адресу с указанием, какие именно данные ты бы хотел получить этим запросом. Поэтому, к слову, GraphQL отлично подходит при использовании в условиях медленного мобильного соединения.
Версии API могут быть головной болью для команд разработчиков. С GraphQL вы можете с этим не беспокоиться. GraphQL позволяет тебе добавить новые поля и типы (это будет обсуждаться позже) в твой GraphQL API, не затрагивая существующие запросы, старые и неиспользуемые же поля могут быть скрытыми от клиентов API. Используя единую эволюционирующую версию, GraphQL API предоставляет вашему приложению постоянный доступ к новым реализациям API и обеспечивают чистую и легко поддерживаемую базу кода.
Перед началом убедитесь, что у вас установлен Node версии 6 и старше. Версию можно проверить командой:
Если у вас не установлена Node, перейдите по URL: https://nodejs.org/ и следуйте иструкция по установке.
Простым способом создания Graph API сервера является использование Express, популярного фреймворка для Node.js. Устанавливаем Express с помощью npm:
Затем устанавливаем `graphql` и `express-graphql`:
Итак, начальная структура папки будет следующая:
В этом небольшом разделе мы попытаем быстро создать простое GraphQL API. Это важно для дальнейшего повествования, чтобы вам стало ясно, что именно мы делаем, что из себя представляет API, созданное с помощью GraphQL. Если некоторые моменты будут казаться сложными и непонятными, не беспокойтесь, мы к ним еще вернемся.
Итак, сейчас мы собираемся использовать объект `buildSchema` из `graphql` для создания схемы (‘schema’). Создаем файл example.js в нашей папке.
Теперь вы можете запустить `example.js` в терминале:
Теперь на localhost:3000 вы сможете обнаружить GraphiQL. Он позволит вам тестировать ваш API в браузере. Он поддерживает автозаполнение и делает предположения для вас на основе типов и полей, доступных в вашей схеме.

Сейчас давайте запросим нашу схему для `blogTitle`:
Вот так просто вы можете запросить API GraphQL’а.
Теперь вы понимаете, как GraphQL работает и можем начать тему поглубже.
Начнем с создания GraphQL сервера на основе Express. Теперь, в нашей папке создайте папку `src`, а в ней создайте и сохраните файл `schema.js`. Этот файл будет выглядеть так:
Далее создайте папку `data` в папке `src`. В нее мы разместим 2 файла: 'authors.js' и 'posts.js'.
Содержимое этих файлов достаточно большое, поэтому не взять их можете по ссылке на Github или под спойлером.
GraphQL имеет модуль 'grapql/type', используемый для определения типа. Типы могут быть импортированы из модуля 'graphql/type' или из корневого модуля 'graphql'
Базовые типы включают ID, String, Int, Float и Boolean. Мы же еще добавляем тип Автор (Author). Для этого в наш файл schema.js добавим:
Как видим, для добавления нового типа нам понадобилось: создать объекта класса GraphQLObjectType и прописать некоторые его свойства. Name и Description — для описания типа, Fields для определения атрибутов типа Author: id, name и twitterHandler.
Более подробнее о типах на graphql.org/graphql-js/type/
А теперь создадим тип для постов (Post):
Добавим это к schema.js. Это создаст объект PostType, который будет использоваться в Root Query( Дословно — корневой запрос. По сути, точка входа к нашему GraphQL API).
Root Query используется для раскрытия ресурсов, доступных клиентам вашего приложения. Мы бы могли сделать 2 ресурса доступными: авторы и посты.
Давайте добавим в наши файл `schema.js`:
Здесь корневой запрос определен как BlogQueryRootType. Если вы заметили, здесь был объявлен новый тип: new GraphQLList(). Он создает обертку вокруг других типов, которая представляет список этих типов.
Схема определяет, как вы хотите, чтобы данные в вашем приложении были сформированы и как вы хотите, чтобы данные были связаны друг с другом. Определение схемы влияет на то, как данные будут храниться в вашей базе данных (или в базах данных). В определении схемы вы также определяете, какие запросы, мутации и подписки будут доступны для вашего интерфейса, отображающего данные.
Давайте добавим схему в наш файл:
Здесь запросу присваивается объект BlogQueryRootType, который будет использоваться в качестве корневого запроса API.
Нам понадобиться пакет `lodash`. `Lodash` это инструментарий, представляющий собой Javascript функции, которые обеспечивают чистые, высокопроизводительные методы для манипуляции с объектами и коллекциями. Если вы были знакомы с библиотекой `underscore`, это здорово! Lodash был создан с него, добавив дополнительную функциональность и решив некоторые проблемы с производительностью underscore.
С помощью этой команды будет установлена библиотека lodash и добавлена соответствующая зависимость в package.json файл.
Добавим следующий код в верхнюю часть файла schema.js.
Теперь давайте посмотрим в файл schema.js. Вот как файл должен выглядеть в конечном итоге.
Если вы заметили в PostType, мы имеем дополнительный атрибут resolve. Resolve представляет собой функцию, которая может манипулировать с данными, преобразовать их значения и т.д. и возвращать их конце операции.
BlogAppSchema будет экспортирована в server.js файл, используя module.exports
Теперь, создайте файл server.js в корневой папке и добавьте этот код:
Сейчас проверим наш результат на localhost:3000. Для этого откройте терминал и выполните:
Результат:

Это graphiql, он поможет вам протестировать API в браузере. Так следующий запрос:
Даст результат вроде этого:

Я так рад, что закончил этот урок с вами. Теперь вы знаете, как создать GraphQL API на основе Express и NodeJS. Я надеюсь, что урок был интересным и вы много узнали с него.
Если вы хотите узнать больше о GraphQL посетите graphql.org.
Пару слов о GraphQL
GraphQL это язык запросов для API, который предлагает декларативный подход к получению данных. Он позволяет клиентам запрашивать только нужные данные с веб-сервера и ничего лишнего. Разработанный еще в 2012 году Facebook’ом, которым по-прежнему и поддерживается, GraphQL стал использоваться многими другими крупными и не очень компаниями. Среди прочих Yelp, Shopify и Github.
При использовании REST APIs обычно запросы отправляются по нескольким адресам, для получения всех необходимых данных в приложении. GraphQL API же позволяет тебе отправлять все запрос по адресу с указанием, какие именно данные ты бы хотел получить этим запросом. Поэтому, к слову, GraphQL отлично подходит при использовании в условиях медленного мобильного соединения.
Версии API могут быть головной болью для команд разработчиков. С GraphQL вы можете с этим не беспокоиться. GraphQL позволяет тебе добавить новые поля и типы (это будет обсуждаться позже) в твой GraphQL API, не затрагивая существующие запросы, старые и неиспользуемые же поля могут быть скрытыми от клиентов API. Используя единую эволюционирующую версию, GraphQL API предоставляет вашему приложению постоянный доступ к новым реализациям API и обеспечивают чистую и легко поддерживаемую базу кода.
Предварительное требование
Перед началом убедитесь, что у вас установлен Node версии 6 и старше. Версию можно проверить командой:
node -vЕсли у вас не установлена Node, перейдите по URL: https://nodejs.org/ и следуйте иструкция по установке.
Настройка GraphQL и Express
Простым способом создания Graph API сервера является использование Express, популярного фреймворка для Node.js. Устанавливаем Express с помощью npm:
npm init
npm install express --save
Затем устанавливаем `graphql` и `express-graphql`:
npm install graphql express-graphql --save Итак, начальная структура папки будет следующая:
|---- node_modules

 |---- package.json
Быстрый старт в GraphQL API
В этом небольшом разделе мы попытаем быстро создать простое GraphQL API. Это важно для дальнейшего повествования, чтобы вам стало ясно, что именно мы делаем, что из себя представляет API, созданное с помощью GraphQL. Если некоторые моменты будут казаться сложными и непонятными, не беспокойтесь, мы к ним еще вернемся.
Итак, сейчас мы собираемся использовать объект `buildSchema` из `graphql` для создания схемы (‘schema’). Создаем файл example.js в нашей папке.
const express = require('express');
const { buildSchema } = require('graphql');
const graphqlHTTP = require('express-graphql');
let port = 3000;

/*  Это простая схема построенная с использванием
    языка схемы GraphQL */

let schema = buildSchema(`
  type Query {
    postTitle: String,
    blogTitle: String
  }
`);

/* root предоставляет функции распознования для каждого
   endpoint'a */

let root = {
  postTitle: () => {
    return 'Build a Simple GraphQL Server With Express and NodeJS';
  },
  blogTitle: () => {
    return 'scotch.io';
  }
};

const app = express();
app.use('/', graphqlHTTP({
  schema: schema,
  rootValue: root,
  graphiql: true // Если true, то отображает GraphiQL
}));             // (браузерная IDE для создания и выполненения запросов к endpoint'ам),
                 // когда endpoint'ы GraphQL были загружены

app.listen(port);
console.log('GraphQL API server running at localhost: ' + port);
Теперь вы можете запустить `example.js` в терминале:
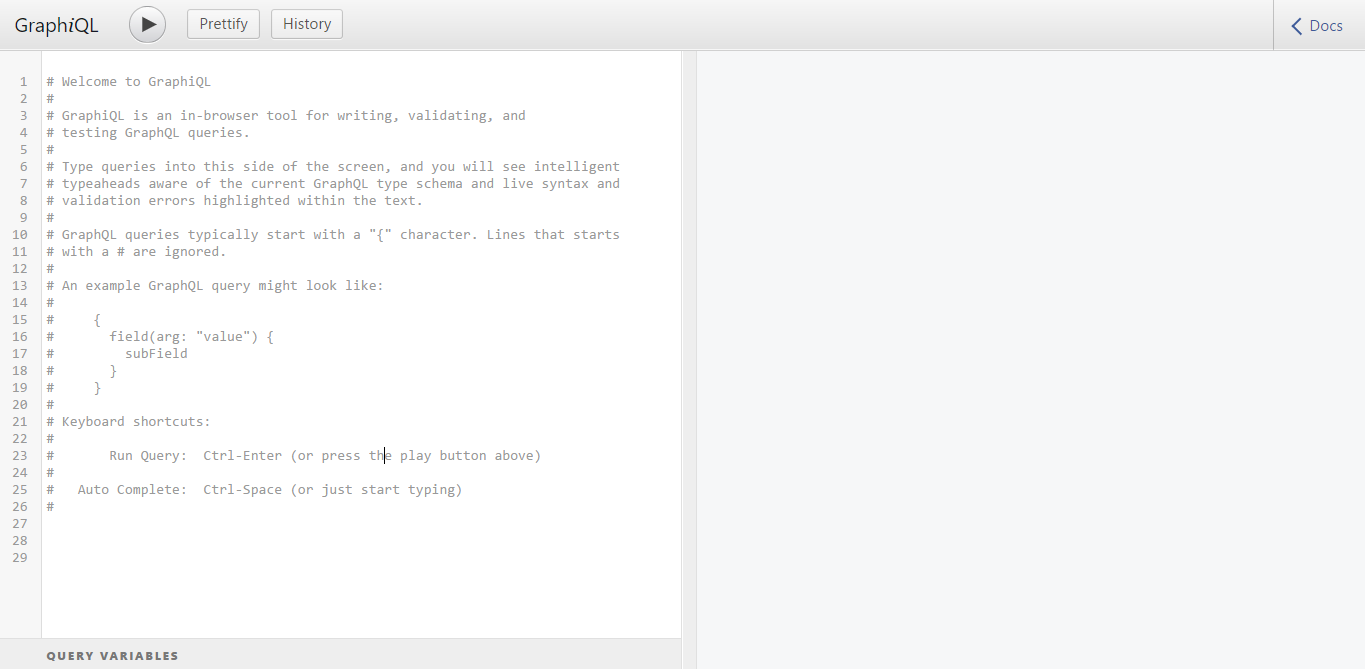
node example.jsТеперь на localhost:3000 вы сможете обнаружить GraphiQL. Он позволит вам тестировать ваш API в браузере. Он поддерживает автозаполнение и делает предположения для вас на основе типов и полей, доступных в вашей схеме.

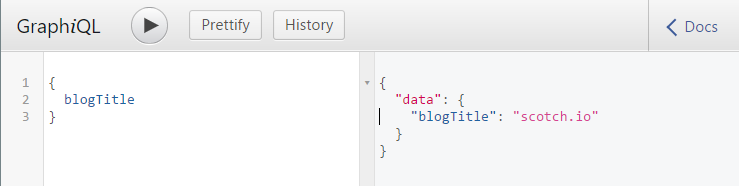
Сейчас давайте запросим нашу схему для `blogTitle`:

Вот так просто вы можете запросить API GraphQL’а.
Введение
Теперь вы понимаете, как GraphQL работает и можем начать тему поглубже.
Начнем с создания GraphQL сервера на основе Express. Теперь, в нашей папке создайте папку `src`, а в ней создайте и сохраните файл `schema.js`. Этот файл будет выглядеть так:
// Authors и Posts получают данные в виде
// JSON массивов с соответствующих файлов
const Authors = require('./data/authors');
const Posts = require('./data/posts');

let {
    // Здесь базовые типы GraphQL, которые нужны в этом уроке
    GraphQLString,
    GraphQLList,
    GraphQLObjectType,
    /* Это необходимо для создания требований
       к полям и аргументам */
    GraphQLNonNull,
    // Этот класс нам нужен для создания схемы
    GraphQLSchema
} = require('graphql');
Далее создайте папку `data` в папке `src`. В нее мы разместим 2 файла: 'authors.js' и 'posts.js'.
Содержимое этих файлов достаточно большое, поэтому не взять их можете по ссылке на Github или под спойлером.
authors.js
const Authors = [
    {
      id: '8dlx7ak38fd39dv79ad',
      name: 'Orinami Olatunji',
      twitterHandle: '@orinami_'
    },
    {
      id: 'jd3kd03d0w9a0l35rh74',
      name: 'Ojima Udale',
      twitterHandle: '@uncooloj'
    },
    {
      id: '0hy894hf0dlkfh9oinv',
      name: 'Xabi Alonso',
      twitterHandle: '@alonso'
    }
  ];

  module.exports = Authors;
posts.js
const Posts = [
{'id':'0176413761b289e6d64c2c14a758c1c7','author_id':'0hy894hf0dlkfh9oinv','author':'alonso', 'category':'meteor','body':'Most developers and companies use two different apps for the marketing website and for the app itself. Thus, they can update each of the apps without affecting the other. [Stripe](https://stripe.com/), [Digital Ocean](https://www.digitalocean.com/) and many other companies follow this technique. Most Meteor apps also do the same.\n\nSo, in a scenario like this, sometimes we need to show the login state of the app on the landing page too. For an example, see our Kadira home page (\u003chttps://kadira.io\u003e). If you are logged into the Kadira app (\u003chttps://ui.kadira.io\u003e), we show a button with "Open Kadira UI" on the home page, which replaces the login button.\n\n[](https://kadira.io)\n\n## How Did We Do It?\n\nMeteor does not have a built-in way to share login states across multiple apps or subdomains. So, we have to find an alternative way to do so.\n\nAs a solution, we can use browser cookies to share the login state between multiple domains. That\'s exactly what we did. We wrapped this up into a Meteor package, which now you can also use.\n\nIn this guide, I\'m going to explain how to share the login state between multiple domains using the [`kadira:login-state`](https://github.com/kadirahq/meteor-login-state) package.\n\n### On Meteor App\n\nFirst of all, install the `kadira:login-state` package in your Meteor app:\n\n~~~\nmeteor add kadira:login-state\n~~~\n\nThen, you need to add a new entry in the `public` object as the `loginState` in the `settings.json` file for your app. (If you haven\'t created the settings.json yet, you need to create it first.)\n\n~~~json\n{\n "public": {\n "loginState": {\n "domain": ".your-domain-name.com",\n "cookieName": "app-login-state-cookie-name"\n }\n }\n}\n~~~\n\nThe `domain` field must be your main domain name, starting with a dot. It allows you to share the login state, which can be accessed from any of its subdomains. You can use any appropriate identifier, such as `cookieName`.\n\nNow, everything has been set up on the Meteor app.\n\n### On the Static App (the Landing Page)\n\nNow we have to show the login state of the app on the landing page. For this, we need to add support for the login state for the static app (or landing page).\n\nActually, there are three different ways to do this. Here I will show you how to do so by pasting a few lines of JavaScript code.\n\nYou need to create a JavaScript file in your js folder. I create it as `js/login_state.js`. After that, copy and paste the following code snippet into it:\n\n~~~javascript\nLoginState = {};\n\nLoginState.get = function(cookieName) {\n var loginState = getCookie(cookieName);\n if(loginState) {\n return JSON.parse(decodeURIComponent(loginState));\n } else {\n return false;\n }\n};\n\nfunction getCookie(cname) {\n var name = cname + "=";\n var ca = document.cookie.split(\';\');\n for(var i=0; i \u003c ca.length; i++) {\n var c = ca[i];\n while (c.charAt(0)==\' \') c = c.substring(1);\n if (c.indexOf(name) != -1) return c.substring(name.length,c.length);\n }\n return;\n}\n~~~\n\nInsert that file into the head section of your HTML document: \n\n`\u003cscript src="js/login-state.js"\u003e\u003c/script\u003e`\n\n\u003e If you prefer, you can also use [Browserify](https://github.com/kadirahq/meteor-login-state#installing-via-browserify) or [Bower](https://github.com/kadirahq/meteor-login-state#installing-via-bower) to load the above JS file.\n\u003e The package name for both Browserify and Bower is `meteor-login-state`.\n\nThen, use the following code to get the login state of your app. You need to provide the relevant `cookieName` to do so: \n\n~~~javascript\nvar loginState = LoginState.get("app-login-state-cookie-name");\nif(loginState) {\n // the user has loggedIn to the meteor app\n // see the loginState Object for the addtional data\n // (append your code here!)\n console.log(loginState);\n} else {\n // user has not loggedIn yet.\n // (append your code here!) \n}\n~~~\n\nThe `loginState` object will be something like this:\n\n~~~json\n{\n timestamp: 1435835751489,\n username: "username",\n userId: "meteor-user-id",\n email: "user@email.com"\n url: "https://ui.kadira.io"\n}\n~~~\n\nNow you can do whatever you need to do with the login state.\n\nGive it a try and let me know what you think.','date':{'$date':'2015-07-07T00:00:00.000Z'},'layout':'blog_post','slug':'sharing-meteor-login-state-between-sub-domains','summary':'In this blog we\'ll show you how we shared login state between our static web app and our Meteor app Kadira UI.','title':'Sharing the Meteor Login State Between Subdomains'},
{'id':'03390abb5570ce03ae524397d215713b','author_id':'0hy894hf0dlkfh9oinv','author':'alonso', 'category':'product','body':'Here is a common feedback we received from our users:\n\n\u003e Hi, I have a suggestion. It would be great if I could "dismiss" errors or mark them as resolved on my end. This way, I can keep track of which errors I have resolved.\n\nToday we are happy to announce new Kadira feature which allows you to track **status** to errors. With that, you can mark errors as "Ignored", "Fixing" or "Fixed".\n\nOnce you mark an error as "Ignored", it will be hidden. \n\nBut you can click on "Show Ignored Errors" checkbox or filter by "ignored" status to view them again.\n\n\n\nYou can also filter errors by status like this:\n\n\n\nWe are rolling out this feature to all our paid users. [Give it a try](https://ui.kadira.io/apps/AUTO/errors/overview?metric=count).\n\n### What’s next?\n\nRight now we are planning to add few more feature related this. Could you help us on [prioritizing](https://orinami.typeform.com/to/hyTwsy) them? Trust me, [it won\'t take a minute](https://orinami.typeform.com/to/hyTwsy).','date':{'$date':'2015-09-01T00:00:00.000Z'},'slug':'tracking-error-status-on-kadira','summary':'Lot of users asked us to add a feature to set status for errors in the Kadira Error Manager. Now, we\'ve that functionality.','title':'New Feature: Tracking Error Status with Kadira'},
{'id':'0be4bea0330ccb5ecf781a9f69a64bc8','author_id':'8dlx7ak38fd39dv79ad','author':'orinami', 'category':'product','body':'\u003cscript type="text/javascript" src="https://gumroad.com/js/gumroad.js"\u003e\u003c/script\u003e\n\nWe are working on the next few major feature releases for Kadira. We would like to know your preference. Pre-order the feature you would most like to see in the next major release (scheduled for August 1).\n\n## Real Client Monitoring\n\nWith Real Client Monitoring, you can learn how your app behaves in actual clients and find client-side bottlenecks. You\'ll be able to see:\n\n* Load time of your app\n* Time taken to connect to the DDP Server\n* Time taken to load the initial subscriptions\n* Time taken to render initial subscriptions\n* Latency values for your methods and publications. You can also break them down into:\n * Network latency for sending requests\n * Server queue time\n * Server processing time\n * Network latency for receiving result/data\n\nComparisons with all of these metrics can be made against countries and browsers (mobiles, desktop, etc.).\n\n\u003e This is an add-on for your app and we charge [**$25 for 50K DDP connections per month**](https://gumroad.com/l/LyDy). You can also enable this add-on even if you have a free plan.\n\u003e\n\u003e 1 DDP connection = 1 Reatime client who established a DDP connection\n\n\u003ca href="https://gumroad.com/l/LyDy" class="gumroad-button"\u003ePre Order Now!\u003c/a\u003e\n\n## CPU/Memory Profiling\n\nYou\'ll be able to create CPU and memory profiles for your app in both development and production. This is an add-on for your app.\n\nThe add-on shows:\n\n* CPU-intensive packages in your app\n* CPU-intensive functions and who created them\n* Capture and compare heap dumps and learn how to find memory leaks with them\n\n\u003e You can enable this add-on for a [**$20/month**](https://gumroad.com/l/EqEf) flat free for you app. You can also enable this add-on even if you have a free plan.\n\n\u003ca href="https://gumroad.com/l/EqEf" class="gumroad-button"\u003ePre Order Now!\u003c/a\u003e\n\n## Better Error Manager\n\nCurrently, we track errors for methods only. With Error Manager, you\'ll be able to track all the server-side and client-side errors.\n\nThe improved Error Manager will be available for any app with a [**paid plan**](https://gumroad.com/l/fRGA).\n\n\u003e Client-side errors will be routed through your app. In future, you\'ll be able to send them directly to Kadira without routing them through your app.\n\n\u003ca href="https://gumroad.com/l/fRGA" class="gumroad-button"\u003ePre Order Now!\u003c/a\u003e','date':{'$date':'2014-06-30T00:00:00.000Z'},'layout':'blog_post','slug':'what-should-kadira-build-next','summary':'We are working on the next few major feature releases for Kadira. We would like to know your preference. Pre-order the feature you would most like to see in the next major release (scheduled for August 1).','title':'What Should Kadira Build Next?'},
{'id':'19085291c89f0d04943093c4ff16b664','author_id':'8dlx7ak38fd39dv79ad','author':'orinami', 'category':'product','body':'Everybody hates errors -- whether it\'s in a Meteor app or not. Unfortunately, errors are something we can\'t avoid. So we must track and handle errors even though, we have tested our app a lot.\n\nIn the recent past, technology has been changed rapidly. But, how we track and fix errors hasn\'t changed that much specially for apps running live on production.\n\nTake a look at the following process. It\'s the process we often used to track and fix errors.\n\n* Capture errors via either logs or using some third party web service.\n* Look for error message and stack trace.\n* Try to locate the relevant place in the code.\n* Then try to fix it.\n\nI don\'t think I need to talk more about this because we all follow the same process.\n\n### Client Side Errors\n\nManaging server side errors is pretty easy compared with client side errors. For server errors all we need to focus on our servers. But tracking client side errors is not that simple.\n\nAlso, we can\'t really depend on stack traces because of the minified code. Even though we capture errors, it\'s not easy as server side errors due to the vendor specific issues and constraints. \n\n## Let\'s fix this!\n\nSo, we\'ve decided to find a cure for this and found a way.\n\nWhat we are doing is pretty simple. Along with capturing the error, we also capture the **context** and **events** related to the error. Then you can reproduce them in your development environment and identify and fix any issues quickly.\n\nCheck following error trace which has been captured with Kadira.\n\n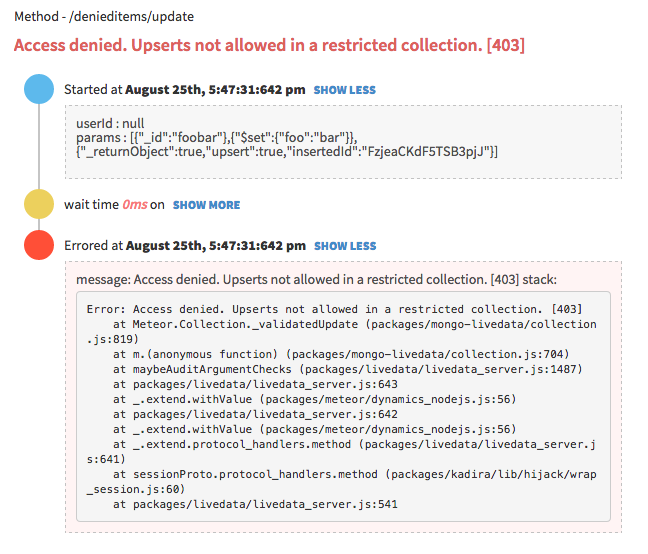\n\nIt contains:\n\n* input parameters for the error;\n* user, who\'s got this error;\n* all the DB, HTTP and other events that have occurred; and\n* the error message and the stack trace.\n\nNow it\'s super-easy to fix the error since you can clearly see what cause the error and it\'s context. We track all kinds of errors including pubsub, method, uncaught exceptions and internal Meteor errors.\n\n### What About Client Side Errors?\n\nWe do the same for client side errors as well. Look at the following error trace.\n\n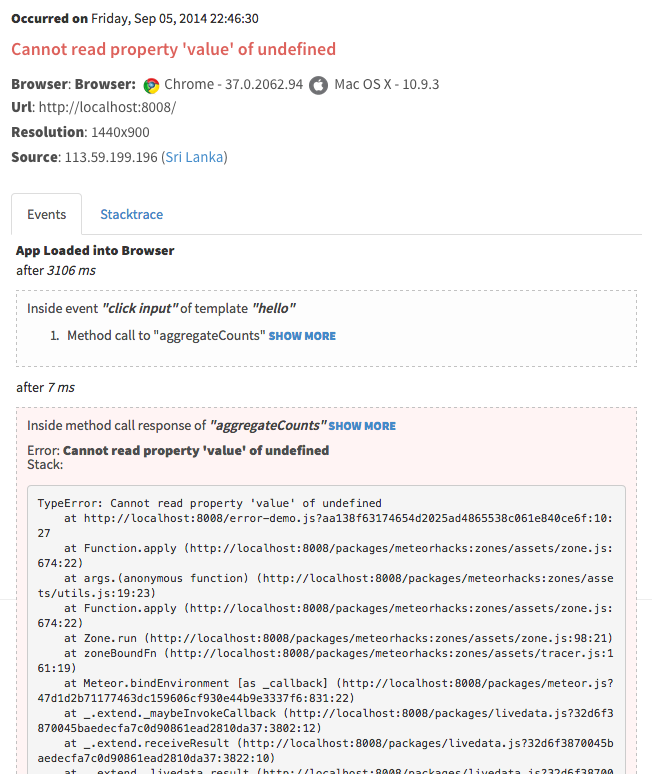\n\nIt has:\n\n* browser information;\n* user information; \n* all the Meteor method calls, subscriptions, sessions and all related events that have occurred;\n* a complete flow of the error starting from the page load event; and\n* the actual error message and stack trace.\n\nNow I think you know what to do with this information.\n\n\u003e we track events using client side zones. So, you need to add [`zones`](https://github.com/meteorhacks/zones) package into your app in addition to [`kadira`](https://github.com/meteorhacks/kadira). Otherwise, you can\'t see events.\n\n## Public Beta\n\nToday, we are happy to announce the public beta of the Kadira\'s Error Tracking solution and invite all of you to start tracking errors with Kadira.\n\nWe\'ve worked so hard on this over the last few months and a lot of people have helped us to test our error tracking solutions—thank you! \n\nSimply update the [`kadira`](https://github.com/meteorhacks/kadira) smart package and visit Errors section on the [Kadira UI](https://ui.kadira.io/).\n\n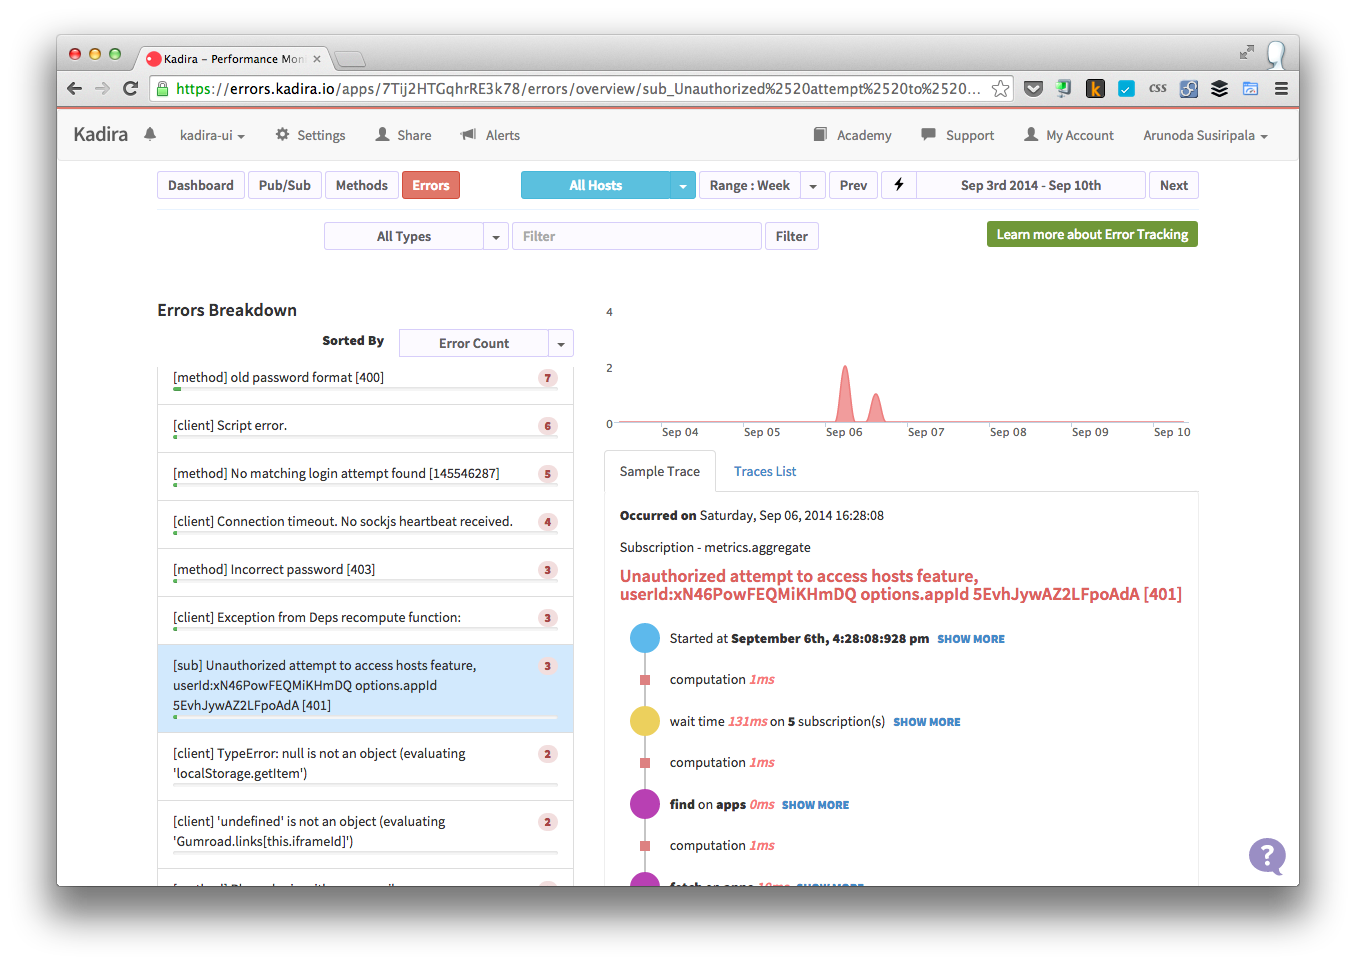\n\n\u003e Error Tracking is free and unrestricted throughout public beta period.\n\nGive it a try and let us know how it goes.','date':{'$date':'2014-09-08T00:00:00.000Z'},'layout':'blog_post','slug':'awesome-error-tracking-solution-for-meteor-apps-with-kadira','summary':'Error tracking is so much important and goes side by side with performance issues. This is the public beta announcement of Kadira\'s error tracking solution.','title':'Awesome Error Tracking Solution for Meteor Apps with Kadira'},
{'id':'1afff9dfb0b97b5882c72cb60844e034','author_id':'8dlx7ak38fd39dv79ad','author':'orinami','category':'product','body':'You might have seen the [EventLoop Utilization](http://support.kadira.io/knowledgebase/articles/372876-event-loop-utilization) chart in our Dashboard. But, it was not correctly working across different hosting platforms. Actually, that value does not reflect any meaning in some situations.\n\n\n\nSo, we\'ve replaced EventLoop Utilization with [CPU Usage](http://support.kadira.io/knowledgebase/articles/378890-cpu-usage). It\'s the actual percentage of CPU spent on your app. Still, you need to be [careful](http://support.kadira.io/knowledgebase/articles/378890-cpu-usage) with analyzing CPU Usage because, some hosting providers have implemented CPU restrictions. But you can see the correct CPU Usage of your app.\n\n\u003e Please upgrade [kadira](https://atmospherejs.com/package/kadira) smart package in order to track CPU Usage. Apply following code:\n\u003e\n\u003e `mrt update`\n\n## How do we track CPU Usage?\n\nThere is no direct API to track CPU usage of your app within your app. But, we are using [usage](https://github.com/orinami/node-usage) npm module for that. In Linux and Solaris, it uses the **/proc** filesystem to read the CPU usage. So, it is very efficient.\n\nHave a good time with improving your application.','date':{'$date':'2014-06-12T00:00:00.000Z'},'layout':'blog_post','slug':'tracking-cpu-usage-with-kadira','summary':'We\'ve replaced EventLoop Utilization chart with actual CPU Usage. See why?','title':'Tracking Meteor CPU Usage with Kadira'},
{'id':'1bd16dfab1de982317d2ba4382ec8c86','author_id':'8dlx7ak38fd39dv79ad','author':'orinami','category':'meteor','body':'Today is holiday for Sri Lanka. But for me, it\'s a hackday. I started playing with React and wrote few simple apps. That\'s a nice experience.\n\nSo, I started thinking why not trying to implement SSR support. It\'s worth trying since now we\'ve all the tools we need.\n\n**Guys, It was a successful experience. Now we\'ve pure SSR support for Meteor.**\n\n### How It Works.\n\nLet\'s have a look at first.\n\n* Demo App: \u003chttp://flow-react-ssr.meteor.com/\u003e\n* Demo App Code: \u003chttps://github.com/orinami/hello-react-meteor\u003e\n\n\u003ciframe width="960" height="720" src="https://www.youtube.com/embed/Qj2eppT27BU?rel=0\u0026amp;showinfo=0" frameborder="0" allowfullscreen="1"\u003e\n\u003c/iframe\u003e\n\nBasically, you just write your Meteor app as you do normally, but using React as the frontend. You use generic Meteor pub/sub to fetch data to the client and render your pages. \n\nHere, you need to use [FlowRouter](https://atmospherejs.com/meteorhacks/flow-router-ssr) and [ReactLayout](https://github.com/orinami/hello-react-meteor/blob/master/lib/react_layout.js) to render react components. ReactLayout is a pretty simple wrapper around `React.render()` which works both on the server and the client.\n\nIn the server, there is very interesting thing is happening. FlowRouter generate an isolated environment for each route. It use existing subscriptions to fetch data and assign them to collections in that environment. So, you don\'t need to change any of your code for the SSR support. \n\nThen when ReactLayout render components, it gets the data filtered by subscriptions for that route. (You can also use component level subscriptions.) \n\nAfter that ReactLayout handover the generate HTML to FlowRouter. This is designed in a way that we can add other layout engine support as well. So, FlowRrouter still doesn\'t directly works with the layout engine.\n\n### Where we can go\n\nThis is just the base work for SSR and there\'s a lot to be done to build a production ready version. But, now everything is clear and it\'s a matter of time we build and ship it. \n\n\u003e This is the something we are going to release with FlowRouter 3.0. We are very close to release FlowRouter 2.0.\n\nI\'ll talk more about this in the upcoming **Kadira Show** and if you like to work on this, just drop me a message.','date':{'$date':'2015-07-01T00:00:00.000Z'},'layout':'blog_post','slug':'meteor-ssr-support-using-flow-router-and-react','summary':'This is an experiment orinami did to implement Server Side Renderng(SSR) using Flow Router and React.','title':'Meteor Server Side Rendering Support with FlowRouter and React'},
{'id':'285292901bb38be8f57dd2885c517826','author_id':'8dlx7ak38fd39dv79ad','author':'orinami','category':'user-story','body':'[Brent Abrahams](http://cn.linkedin.com/pub/brent-abrahams/87/372/ba1) is a mathematics teacher who has build an online curriculum management app [Standbench](http://cn.linkedin.com/pub/brent-abrahams/87/372/ba1) for his organization using Meteor. He has a [nice story](http://meteorhacks.com/meteor-in-production-a-case-study.html) with the initial stage of his applications and how he used Oplog with his application.\n\nRecently, we was able to figure out a potential issue of one of his server with the data from Kadira. This is how he talked about it.\n\n"Kadira did give me a heads-up a couple of days ago that one of my servers was in trouble, as I saw an unusual increase in the number of publications and methods being called. So I restarted the server and watched everything settle back into the normal pattern. That was nice! The real-time aspect of the Kadira admin console is just great."\n\nBrent also showed how he used Kadira with his development workflow.\n\n\u003ciframe width="640" height="480" src="//www.youtube.com/embed/MUTn6hdfV64" frameborder="0" allowfullscreen="1"\u003e\n\u003c/iframe\u003e','date':{'$date':'2014-05-27T00:00:00.000Z'},'layout':'blog_post','slug':'user-stories-brent-abrahams','summary':'Denis has been using Kadira from the initial beta release and helped us a lot on identifying issues with Kadira. This is how he is using Kadira.','title':'How Brent is using Kadira with his development workflow'},
{'id':'2f6b59fd0b182dc6e2f0051696c70d70','author_id':'8dlx7ak38fd39dv79ad','author':'orinami','category':'other','body':'This is a short guide to remind you about means, histograms and percentiles in statistics. Then, we will discuss why all these matter and when we can use each of them.\n\n## Our Data Set\n\nFirst, we need a data set so we can calculate these measurements. We will look at a collection of response times collected over a minute from a web app. Here are those values (they are in milliseconds):\n\n~~~\n255, 168, 125, 11102, 59, 120, 500, 2, 98, 25\n~~~\n\nBy just looking at the data set, it\'s hard to get a clear picture. \nIt would be impossible, if we had a larger data set. (Normally, we\'ll have larger data sets.)\n\n\u003e You can access these values in a [Google Sheet](https://docs.google.com/spreadsheets/d/1JsDB2ryWKBcSLRy-YHIjfIs-ESFZq2k3N7ggdVz5O84/edit?usp=sharing), which also has each of the measurements we are looking at in this article.\n\n## Analyzing the Data Set\n\nNow we need to analyze this data set and get some information from it. That\'s why we need to build some measurements.\n\n## Mean\n\nMean is the easiest measurement to generate. Simply add all the numbers together and divide by the number of items.\n\nFor this data set, the mean is **1245.4 milliseconds.**\n\nThat is, on average it took more than 1245 milliseconds to process a single request.\n\n\u003e The mean is a good measurement for representing a whole data set as a single value.\n\n## Histograms\n\nSometimes mean **does not** represent a data set accurately. For our data set, we got a mean of 1245 milliseconds. But, just by looking at the data set, we know a lot of requests took less than 200 milliseconds. So, the mean is not a good representation for our data set.\n\nMean has a higher value because it\'s sensitive to **outliers** like 11,102 milliseconds.\n\nSo, a histogram is the answer. It gives us a better view of the data set.\n\nHere\'s the histogram for our data set:\n\n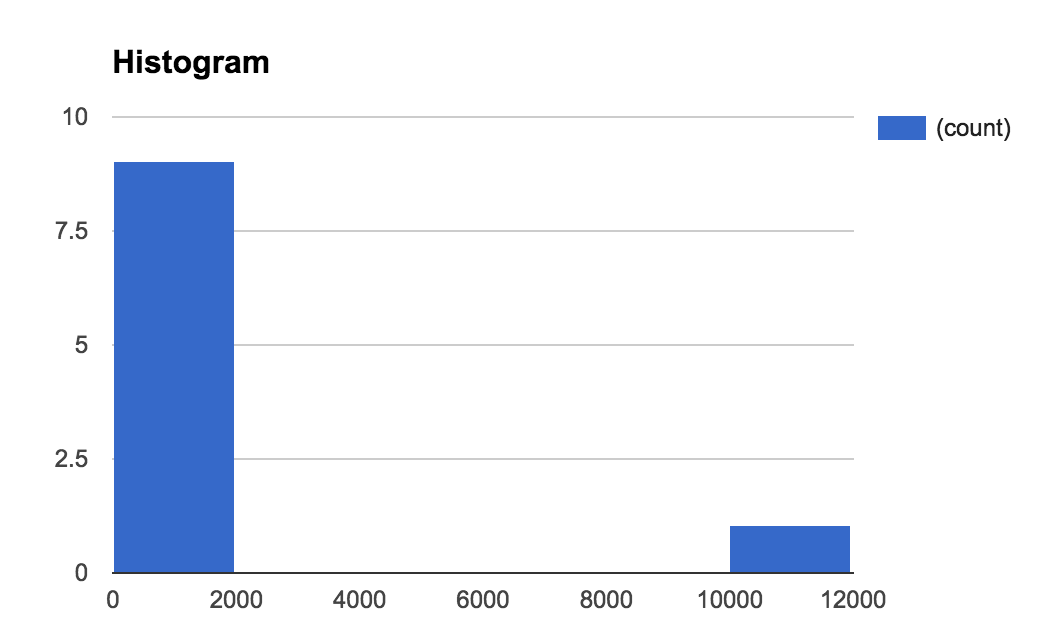\n\nIn the histogram, we group data points into equal groups. We call such a group a bin. The size of our bins (binSize) is 1000 milliseconds.\n\nIt\'s clear that we\'ve an outlier. We can get even more information if we make our bin size smaller.\n\n\u003e A histogram is a good tool for visualizing a data set. We can see what really happened.\n\n### Summarizing\n\nHistograms are always useful for visualizing a data set. But, we can\'t measure two different histograms and compare them easily. That\'s why we need to generate summary measurements from a histogram (or from the data set directly). \n\nLet\'s have a look at a few such measurements.\n\n#### Median\n\nMedian is the value in middle of the data set. We can simply get it by sorting the data set and picking the value in the middle. In our data set, it\'s **122.5 milliseconds.**\n\nWhat does the median represent? For 50% of the events, our response time was shorter than 125.5 milliseconds.\n\n\u003e So, the median gives us useful information about our data set and it\'s not sensitive to outliers.\n\n#### Percentiles\n\nTo calculate a percentile, we need to sort our data set and divide it into 100 equal groups. So, the 90th percentile is the value at beginning of the 90th group.\n\nIn our case, the 90th percentile is **1560.2 milliseconds.**\n\nThis means that more than 10% of our user base experienced a response time of 1560 milliseconds or higher. Alternatively, 90% of our users had a response time less than 1560 milliseconds.\n\n\u003e Median is equivalent to the 50th percentile. Percentiles are not sensitive to outliers.\n\n## Using All These Measurements\n\nWe can\'t say that one measurement is good or bad. Each of them has its own purpose. Let\'s discuss this. \n\n\u003e We will use the *response time* as an example metric, but our comments hold for any kind of metric. \n\n**Mean is a good measurement if we need to compare response times in different periods.**\n\nFor example, we can plot means for each minute as a graph to see how it behaves. Since it\'s sensitive to outliers, we **can** see them as well. Have a look at the following graph:\n\n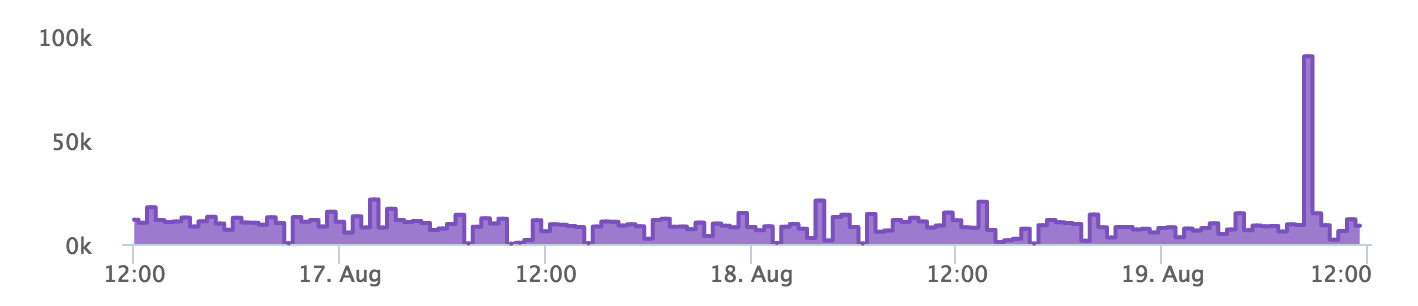\n\nThere\'s a spike at the end of this chart. So, we can tell that there was something wrong then. We can now drill down into the data set at that time and find the problem.\n\n**That\'s when histograms and summary measurements come in handy.**\n\nLet\'s have a look at the histogram of our data set at that time:\n\n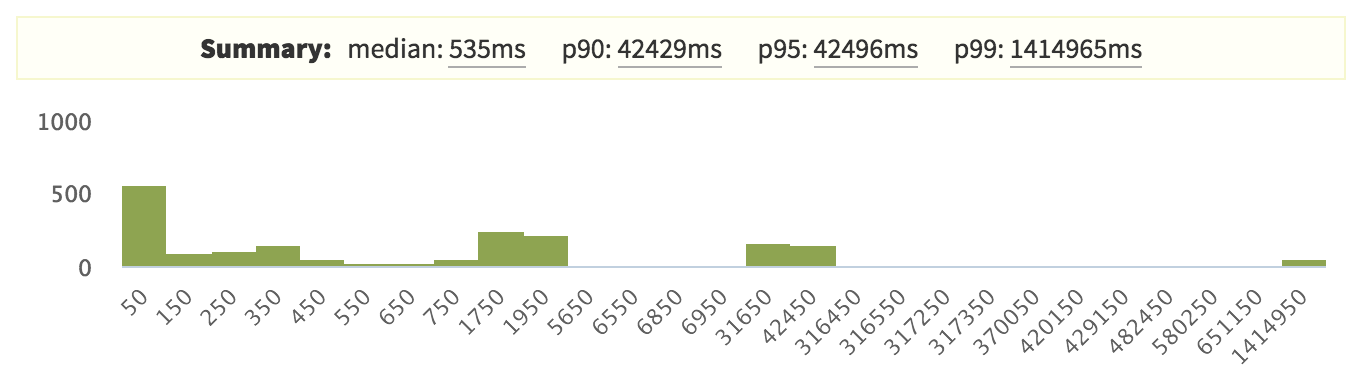\n\nHere, the 99th percentile is very high compared with the other percentiles, which indicates that there is an outlier.\n\nBut interestingly, our 90th and 95th percentiles are also quite high. So, that seems like a problem.\n\n\u003e Normally, we try to reduce response times. That\'s why we never look at lower percentile values like the 5th percentile. But, depending on your data set, you can pick any percentile you want.\n\nFor the response time, we usually look at the median, the 90th, 95th and 99th percentiles. It\'s up to you to decide which percentile you are going to look at. \n\nIf the response time is very critical to your app, you can try to reduce the 99th percentile. Otherwise, you could try to optimize the response time for the 90th or 95th percentile.\n\nIf you are really not worried about the response time, you could try to optimize the median.','date':{'$date':'2015-08-24T00:00:00.000Z'},'layout':'blog_post','slug':'mean-histogram-and-percentiles','summary':'A short guide to means, histograms and percentiles and how we can use them in a real situation.','title':'Understanding Mean, Histogram and Percentiles'},
{'id':'3d7a3853bf435c0f00e46e15257a94d9','author_id':'8dlx7ak38fd39dv79ad','author':'orinami','category':'product','body':'Today, I\'m very excited to be launching Kadira Debug version 2. This version comes with a lot of UI improvements and few CPU related functionalities.\n\n## Installation\n\nThis version of Kadira Debug is published as a new package: `kadira:debug`. So, you need to remove `meteorhacks:kadira-debug` if it\'s in your app:\n\n~~~\nmeteor remove meteorhacks:kadira-debug\nmeteor add kadira:debug\n~~~\n\nAfter you\'ve added `kadira:debug`, simply visit \u003chttp://debug.kadiraio.com/debug\u003e and you\'ll be able to see what\'s going on in your app.\n\nLet me show you couple of new features and enhancements that we\'ve added.\n\n### CPU Usage Monitoring\n\nThese days we do many things on the client side, which means there is a lot of CPU activities on the client side of your app. Sometimes, your app will become slower to use because of these activities.\n\nNow, we\'ve a real-time CPU usage monitor based on [EventLoop usage](https://kadira.io/platform/kadira-debug/cpu-monitoring):\n\n[](https://kadira.io/platform/kadira-debug/cpu-monitoring)\n\n### Improved Event Stream\n\nIn the previous version, the event stream was very hard to use if there was a lot of data in it. Now the event stream will pause if you click on it. Also, now you\'ll be able to filter the event stream for the data you actually need:\n\n\u003ca href="https://kadira.io/platform/kadira-debug/event-stream"\u003e\n \u003cimg \n src="https://cldup.com/i7bxh6m2WL.jpg" \n alt="Improved Event Stream" \n data-gif="https://cldup.com/aQC6-NFYNK.gif"/\u003e\n\u003c/a\u003e\n\n### CPU Profiling\n\nNow you can analyze both client and server CPU profiles using our CPU analyzer. Earlier it was only available inside our Kadira app and it was a bit hard to use. Now anyone can use it.\n\n[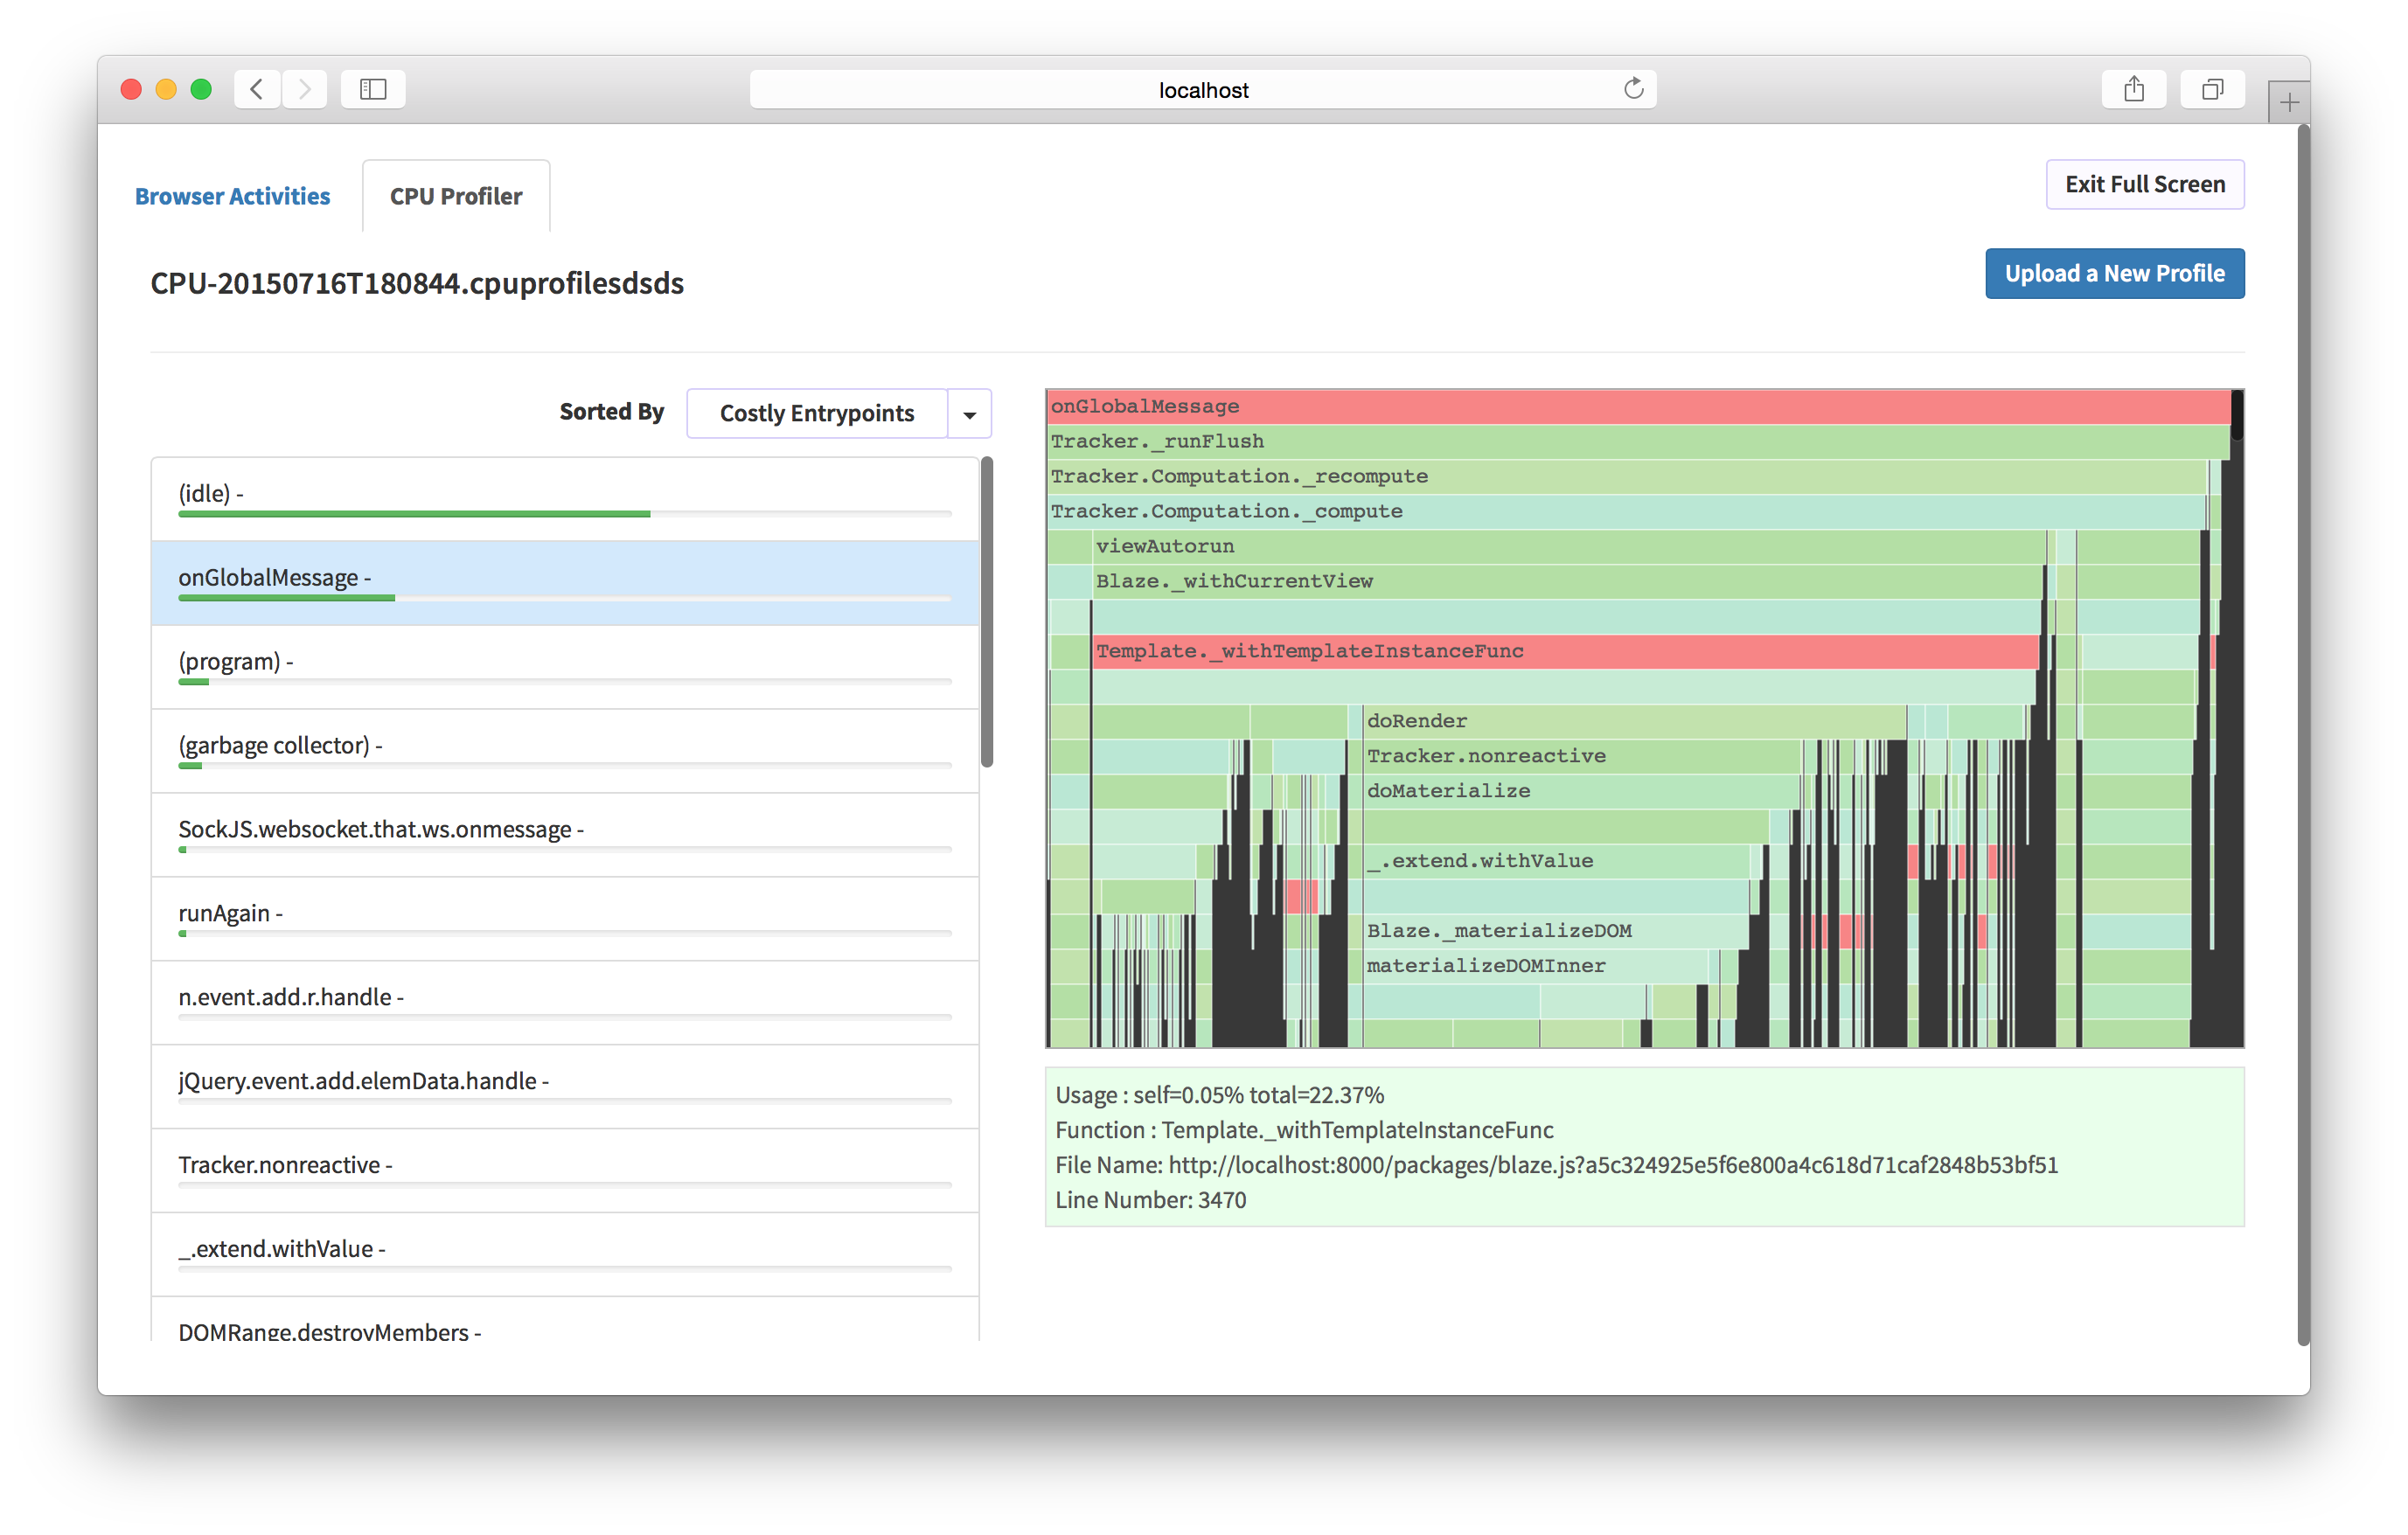](https://kadira.io/platform/kadira-debug/cpu-profiling)\n\n### Lots of UI Improvements\n\nBesides these major changes, we\'ve added many UI improvements, making Kadira Debug very productive to use. \n\nTry the new [Kadira Debug](http://debug.kadiraio.com/debug) and let us know what you think about it.','date':{'$date':'2015-07-20T00:00:00.000Z'},'layout':'blog_post','slug':'introducing-kadira-debug-v2','summary':'Today, we are introducing a new version of Kadira Debug. It comes with many UI improvements and support for CPU profiling.','title':'Introducing Kadira Debug, Version 2'}
];
module.exports = Posts;Типы в GraphQL
GraphQL имеет модуль 'grapql/type', используемый для определения типа. Типы могут быть импортированы из модуля 'graphql/type' или из корневого модуля 'graphql'
Базовые типы включают ID, String, Int, Float и Boolean. Мы же еще добавляем тип Автор (Author). Для этого в наш файл schema.js добавим:
const AuthorType = new GraphQLObjectType({
  name: "Author",
  description: "This represent an author",
  fields: () => ({
    id: {type: new GraphQLNonNull(GraphQLString)},
    name: {type: new GraphQLNonNull(GraphQLString)},
    twitterHandle: {type: GraphQLString}
  })
});
Как видим, для добавления нового типа нам понадобилось: создать объекта класса GraphQLObjectType и прописать некоторые его свойства. Name и Description — для описания типа, Fields для определения атрибутов типа Author: id, name и twitterHandler.
Более подробнее о типах на graphql.org/graphql-js/type/
А теперь создадим тип для постов (Post):
const PostType = new GraphQLObjectType({
  name: "Post",
  description: "This represent a Post",
  fields: () => ({
    id: {type: new GraphQLNonNull(GraphQLString)},
    title: {type: new GraphQLNonNull(GraphQLString)},
    body: {type: GraphQLString},
    author: {
      type: AuthorType,
      resolve: function(post) {
        return _.find(Authors, a => a.id == post.author_id);
      }
    }
  })
});
Добавим это к schema.js. Это создаст объект PostType, который будет использоваться в Root Query( Дословно — корневой запрос. По сути, точка входа к нашему GraphQL API).
Root Query
Root Query используется для раскрытия ресурсов, доступных клиентам вашего приложения. Мы бы могли сделать 2 ресурса доступными: авторы и посты.
Давайте добавим в наши файл `schema.js`:
const BlogQueryRootType = new GraphQLObjectType({
  name: 'BlogAppSchema',
  description: "Blog Application Schema Query Root",
  fields: () => ({
    authors: {
      type: new GraphQLList(AuthorType),
      description: "List of all Authors",
      resolve: function() {
        return Authors
      }
    },
    posts: {
      type: new GraphQLList(PostType),
      description: "List of all Posts",
      resolve: function() {
        return Posts
      }
    }
  })
});
Здесь корневой запрос определен как BlogQueryRootType. Если вы заметили, здесь был объявлен новый тип: new GraphQLList(). Он создает обертку вокруг других типов, которая представляет список этих типов.
Определение схемы
Схема определяет, как вы хотите, чтобы данные в вашем приложении были сформированы и как вы хотите, чтобы данные были связаны друг с другом. Определение схемы влияет на то, как данные будут храниться в вашей базе данных (или в базах данных). В определении схемы вы также определяете, какие запросы, мутации и подписки будут доступны для вашего интерфейса, отображающего данные.
Давайте добавим схему в наш файл:
const BlogAppSchema = new GraphQLSchema({
    query: BlogQueryRootType
    /* Если вам понадобиться создать или
       обновить данные, вы должны использовать
       мутации.
       Мутации не будут изучены в этом посте.
       mutation: BlogMutationRootType
    */
});
Здесь запросу присваивается объект BlogQueryRootType, который будет использоваться в качестве корневого запроса API.
Реализация GraphQL API
Нам понадобиться пакет `lodash`. `Lodash` это инструментарий, представляющий собой Javascript функции, которые обеспечивают чистые, высокопроизводительные методы для манипуляции с объектами и коллекциями. Если вы были знакомы с библиотекой `underscore`, это здорово! Lodash был создан с него, добавив дополнительную функциональность и решив некоторые проблемы с производительностью underscore.
npm install lodash --saveС помощью этой команды будет установлена библиотека lodash и добавлена соответствующая зависимость в package.json файл.
Добавим следующий код в верхнюю часть файла schema.js.
const _ = require('lodash');Теперь давайте посмотрим в файл schema.js. Вот как файл должен выглядеть в конечном итоге.
const _ = require('lodash');

// Authors и Posts получают данные в виде
// JSON массивов с соответствующих файлов
const Authors = require('./data/authors');
const Posts = require('./data/posts');

let {
    // Здесь базовые типы GraphQL, которые нужны в этом уроке
    GraphQLString,
    GraphQLList,
    GraphQLObjectType,
    /* Это необходимо для создания требований
       к полям и аргументам */
    GraphQLNonNull,
    // Этот класс нам нужен для создания схемы
    GraphQLSchema
} = require('graphql');

const AuthorType = new GraphQLObjectType({
    name: "Author",
    description: "This represent an author",
    fields: () => ({
        id: { type: new GraphQLNonNull(GraphQLString)},
        name: { type: new GraphQLNonNull(GraphQLString)},
        twitterHandler: {type: GraphQLString}
    })
});

const PostType = new GraphQLObjectType({
    name: "s",
    description: "This represent a s",
    fields: () => ({
        id: {type: new GraphQLNonNull(GraphQLString)},
        title: {type: new GraphQLNonNull(GraphQLString)},
        body: {type: GraphQLString},
        author: {
            type: AuthorType,
            resolve: function(post) {
                return _.find(Authors, a => a.id == post.author_id);
            }
        }
    })
});

const BlogQueryRootType = new GraphQLObjectType({
    name: "BlogAppSchema",
    description: "Blog Application Schema Query Root",
    fields: () => ({
        authors: {
            type: new GraphQLList(AuthorType),
            description: "List of all Authors",
            resolve: function() {
                return Authors
            }
        },
        posts: {
            type: new GraphQLList(PostType),
            description: "List of all Posts",
            resolve: function() {
                return Posts
            }
        }
    })
});

const BlogAppSchema = new GraphQLSchema({
    query: BlogQueryRootType
    /* Если вам понадобиться создать или
       обновить данные, вы должны использовать
       мутации.
       Мутации не будут изучены в этом посте.
       mutation: BlogMutationRootType
    */
});

module.exports = BlogAppSchema;
Если вы заметили в PostType, мы имеем дополнительный атрибут resolve. Resolve представляет собой функцию, которая может манипулировать с данными, преобразовать их значения и т.д. и возвращать их конце операции.
BlogAppSchema будет экспортирована в server.js файл, используя module.exports
Теперь, создайте файл server.js в корневой папке и добавьте этот код:
const express = require('express');
const graphqlHTTP = require('express-graphql');
const schema = require('./src/schema.js');

let port = 3000;
const app = express();
app.use('/', graphqlHTTP({
  schema: schema,
  graphiql: true
}));

app.listen(port);
console.log('GraphQL API server running at localhost:'+ port);
Сейчас проверим наш результат на localhost:3000. Для этого откройте терминал и выполните:
node server.jsРезультат:
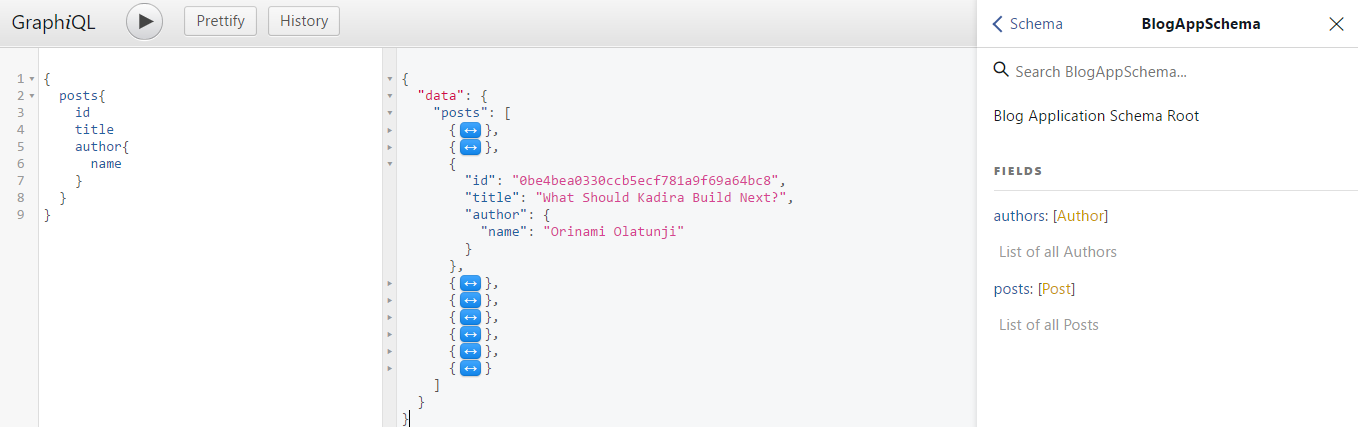
Это graphiql, он поможет вам протестировать API в браузере. Так следующий запрос:
 {
  posts {
            id
            title
            author {
                  name
            }
          }
}
Даст результат вроде этого:
Вывод
Я так рад, что закончил этот урок с вами. Теперь вы знаете, как создать GraphQL API на основе Express и NodeJS. Я надеюсь, что урок был интересным и вы много узнали с него.
Если вы хотите узнать больше о GraphQL посетите graphql.org.
