Also published on AgileSoftwareDevelopment.com
Nowadays a lot of product managers have to confirm most of their decisions with AB-tests. Yet, it is far not always clear how to choose the parameters for the test. A particularly difficult parameter to tune is often the level of statistical significance. If we choose too high level - tests will fail even though improvements do exist. If we choose too low level - we'll be getting lots of "confirmations" of false improvements.
When we make decisions based on AB-tests, once in a while we'll be making mistakes. We can limit the losses caused by such mistakes by choosing the appropriate level of statistical significance.
Signup with the phone number
Imagine that you are a product manager in a company running a typical web service.
You are working on the ways for increasing the amount of signups. You examine the signup process steps and notice that many visitors stop when they need to enter their email address. So you decide to try asking for a phone number instead.
Using phone number for identifying the users is not exactly a widely used practice yet and comes with the need to pay for a text message for activation. However, nowadays people aren't that much into email anymore and do everything on the phone - so possibly phone number-based signups have the potential for bringing in more users.
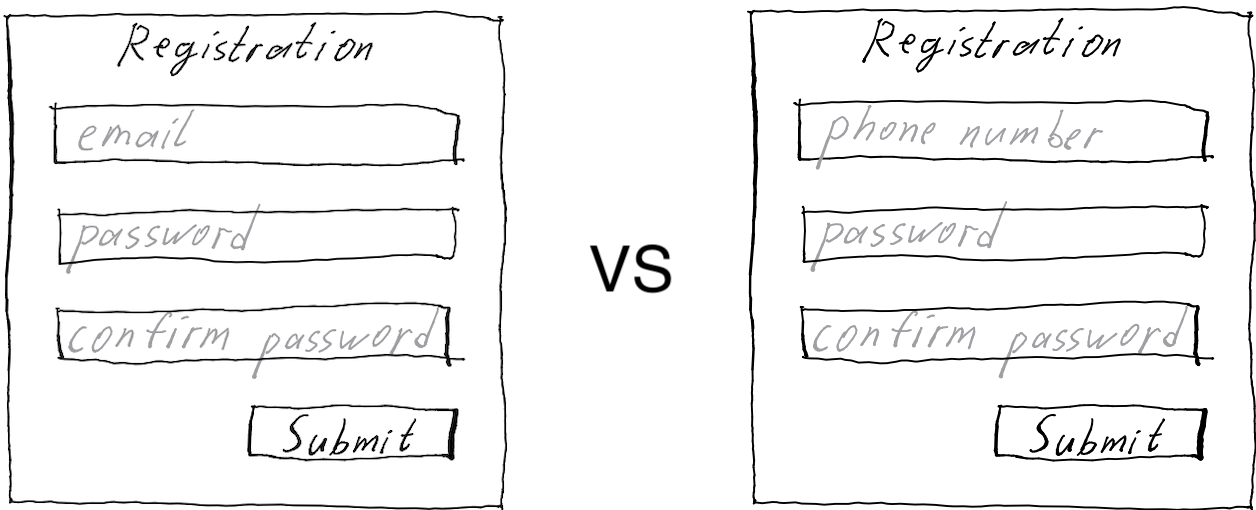
That makes quite a regular product management challenge. We like verifying that our ideas bring value indeed, so we construct two signup page variants: old - with the email address and new - with the phone number. We show each of these variants to random 5% of the visitors and measure how large share of them enter their email/phone number and activate the account within, for example, a day.

Planning the experiment
Let's suppose we have planned the experiment using any usual AB-test planning calculator, we did everything carefully, chose a one-sided hypothesis (we are interested in detecting improvements only) and... what level of statistical significance do we choose?
Quite often in the product team there is a "usual" level of statistical significance, such as 95%, that everybody chooses just because everyone else is using the same number as well. However, couldn't this particular test be fine with just 90% or even 80%? We wouldn't like to skip the useful improvement just because we are not absolutely certain in it, would we?
What test results actually mean
We certainly wouldn't like our test to fail, so we go for the lowest level that people around us use,- say, for 90%. We have launched the test and it ran for five full weeks (full weeks to smoothen out the possible weekday-weekend differences). Every variant was seen by about 10,000 people and the test has completed successfully. The test results calculator congratulated us with something like "p-value is 0.07, You can be 90% confident that this result is a consequence of the changes you made". What does it really mean?
One easy way to interpret an AB test is to reverse the statement we are trying to prove. We can never be completely sure that the offer to enter a phone number brings more signups on average - there is always a possibility that over a long period of time phone signups bring in as many users as email signups or even less. It could be so that exactly during or test weeks a random fluctuations has brought more telephone signups than email signups.
If phone signups aren't any better on average, they will still randomly win in some tests.
P-value of the AB test shows how rare an event we observe if the suggestion to enter a phone number in fact (over a long period of time) does not improve anything, and possibly even worsens the conversion.
Imagine that in such a sad situation we conduct not one, but a hundred of identical AB tests: each for the same five weeks, each with 10,000 visitors per variant. In most of these 100 tests, the phone option will bring fewer or same number of signups as the email option. However, in some of the tests, the phone option may bring same number of signups or a little more by chance. Among these few fluctuations usually the phone option would win over an email just a tiny bit. In our particular experiment we have observed such a fluctuation that could be expected in no more than seven trials out of hundred - thus p-value of 0.07.

The choice of the statistical significance level shows how rare the observed difference in conversions between the options must be for us to acknowledge such a difference as poorly explainable by a random fluctuation. Based on it we can then make a decision on whether to switch to phone numbers.
The cost of a mistake
The key point of interpretation is that even if we conduct everything carefully, without technical and logical errors, our AB-tests will still "confirm" false hypotheses from time to time.
If we make decisions based on the tests, once in a while we will make mistakes. However, by choosing the level of statistical significance we can limit the amount of such mistakes and the losses they can bring.
If making a mistake costs a lot (e.g., we will not sell anything without registering users!) - we'll want choose a high level of significance. However, a high level of statistical significance will not come for free - we will have to increase the duration of tests significantly. If we don't, then only variants that give a very significant increase in a target metric can win confidently. As a result, we will either miss out on small improvement opportunities, or we will have time to carry out very few experiments only. Fortunately it is rather easy to estimate the effect of this or that significance level on the value and costs of carrying out the test.
Based on our knowledge of the subject area and the history of previous changes let's assume that a successful transition to phone registrations could increase the conversion rate by 5 percent. If we mistakenly switch to phone registrations, then perhaps half of the visitors would not be able or will not want to register. Below we will discuss where we can get such assumptions from.
Average number of signups per week | 2000 |
|---|---|
How many more users can phone signup bring in compared to email registration | 5% |
How many less users can phone signup bring in in case of a mistakenly succeeded test | 50% |
If everything is fine than a year of phone signups will bring that many more users | 52 * 2000 * 5% = 5200 |
If we have implemented phone-based signups after a mistakenly winning test we will lose this many users over a year | 52 * 2000 * 50% = 52000 |
Chosen level of statistical significance | 95% |
If we wouldn't be making any changes and everything remained constant, then over a year we'd get this many new users | 52 * 2000 = 104000 |
If we'd carry out such experiments all the time, then an average experiment would bring this many additional users over a year | 95% * 5200 - (100%-95%) * 52000 = 2340 |
Average similar experiment would add this much growth to the user audience | = 2340 / 104000 = 2.25% |
You can find this table in Google Sheets and copy it for yourself.
Selecting the level of statistical significance
In the example above we have assumed that phone registration could possibly bring some 5% more signups than we currently have. Then we have assumed that if phone signups win by accident, then implementing them would decrease signups some 50%. Where did we get such numbers from?
It is certainly best to rely on the history of similar improvement attempts. If trying to improve the signup rate is something we do regularly and most of the previous ideas were able to improve the conversion just a couple of percent, then we know that even a very significant idea is unlikely to improve the situation more than 5-10%.
If there is no history of similar changes or such history is tiny, then I do not know a better method than to base on expert opinions and fears**.** It sounds quite unlikely that half of potential users do not register just because they do not want/cannot enter an email. In the best case, migration to a phone number option would raise the share of registrations from 7.7% to something like 8% (5% improvement). However, if we are mistaken and users really do not want to trust us their phone numbers, then it is possible/scary to lose even half of the registrations.
The numbers in the table are selected in such a way that with a 90% significance level, the experiment does not make much sense. With the 90% level we would make wrong decisions too often when conducting such experiments over and over again. At 95% significance level, it seems that an average experiment of this kind can bring value, but not much. Choose 95% and we'll get only a couple of percent of additional users after implementing the change. Then is it worth to test the idea of phone signups with the AB-test at all? Would it be better to make a decision based on the intuition of some top manager? Or shall we possibly just repeat what all the competitors on the market do?
Not sure - verify stricter
If the entire previous team was fired yesterday, we know very little about the market and potential users, then our ideas might make very little sense indeed. Then certainly it would be nice to test ideas for improvements more strictly.
For example, let's put incredibly high fears in the table. Imagine that we cautiously guesstimate the possible positive effect to be just 2-3%. Then imagine we know our market so little that we are afraid of loosing up to 99% of signups in case of a wrong decision. For instance, it could be possible if we didn't realize that incoming text messages are paid in our target market. Then almost everybody would be not willing to pay for just a signup.
Even in such a sad situation, when we are not sure of both the market and our ideas, if we get the statistical significance level to 99%, then a wave of such experiments will still bring value. Experiments will take an incredibly long time to complete, yet if we have that time, then the wrong ideas would be implemented extremely rarely.
A small improvement repeated many times is a big improvement
An extra couple of percent of signups over a year is not a lot, unless we have millions of users already. However, a score of such modest experiments carried out one after another will already bring almost 50% additional users (20 repetitions of the 2.25% improvement from our example will bring 56%: $1.0225^{20}\approx1.56$).
A culture of permanent small experiments can unfortunately distract us from coming up with the breakthrough ideas, but it can bring significant value by optimizing the existing solutions.
We can observe the situation after making a decision
It would be great to observe users for some time after implementing the decision. For example, after our five week long experiments where the phone number signups have won, we can enable phone signup for 95% of visitors. Let's offer the remaining five percent the old email-based signup still. Then we could compare the results of both options after some 25 weeks instead of just five.
If we apply such approach of post-implementation tests all the time, then we can take it into account in the guesstimation table above. For example, if we always double-check the effect some four months after implementing the winning option, then we could assume the negative effect to be present for four months max as well. That would allow us to conduct experiments with the lower level of statistical significance. We would be able to conduct the experiments more often at the cost of a headache with the presence of even more service variants working simultaneously, and a cost of difficulties with the public announcements (for some users, the old solution may be shown for four more months).
Test ideas that make sense
Fortunately or unfortunately, but statistical research does not eliminate the need to think. Understanding the market, users, their habits and service history allows us to come up with the hypotheses that have a greater chance of improving the situation.
For example, if we have been working on the service for several years and we know that it is used to order quite unique business tools, then even a very inconvenient signup process would hardly alienate more than a few percent of users. Then the fear of loss can be limited, for example, to 20%. In such a case the guesstimation table will suddenly tell us that the significance level of 85% or even 80% is good enough. That would reduce the time required for the experiment drastically.
If we know from the previous trials that even the most radical changes never improve or worsen the situation by more than a few percent, then we can enter such numbers to the guesstimation table. For example, let's estimate the possible benefit at 2%, and the possible harm at 5%. As a result, again it turns out that 80% significance level is good enough. Then we could carry out the experiments and improve our service much faster.
If we are afraid that a particular idea carries a lot of risk (for example, we are afraid of that almost all potential users could refuse to give their phone number), then it could be worth coming up with a less destructive experiment to test the assumption. For example, why not try accepting both the phone number and email? Such approach would reduce the potential negative effect dramatically - only those who really do not understand what we want from them would leave. Then we could make the final decision on whether to migrate to phone numbers by just looking at what users prefer to use over time.

It makes sense to make some changes, even if we can't confirm the positive effect
If the company strategy is to switch all the services to identifying customers by phone number, then we'd need to have very serious arguments for rejecting such changes. Or sometimes the experiment length calculator shows that insane duration is needed to refute the negative or zero effect of the changes reliably. Then we can try to plan an experiment that confirms that the change, even if worsens the situation, does it is no more than a couple of percent. For example, this calculator allows for such a test.
So how to choose the appropriate level of statistical significance and analyze the test results?

Interpret the results of the completed tests with a calculator that formulates and phrases the results correctly. For example, with the help of productab.com, made by yours truly
That said the math in all good calculators that is nearly the same: this, [this](https://www.analytics-toolkit.com/statistical-calculators /) (paid), and this calculators would calculate everything fine - just remember how to interpret the results correctly
Estimate the cost of mistakenly winning experiments for your service as we did above and choose a few standard or not-so-standard rules. For example, something like:
"We test experiments with the possible customer loss with a 95% significance level."
"We test the usual small improvements with a 90% significance level."
"We test small trivial things such as changes in texts and colors in places not related to payment with 80% significance. If the calculator recommends the length of the experiment to be longer than a week, then we skip testing altogether."
And of course, get more experience, get to know your users better, so you could invest in experiments that can improve something indeed. Perhaps in experiments that radically change the entire process of using the service. For example, what if in our imaginary service we decide to skip the whole concept of user accounts completely and accept payments from any unregistered visitor with a credit card in hand?
How do you interpret the AB test results?
What is the scale of your product, how do you conduct tests and choose the level of statistical significance? How do you interpret the test results?
