Тема, насколько старая, настолько же и актуальная. Поделюсь, своим концептом на архитектуру провиженинга тестовых субд, с целью получения комментариев по существу - может кто ходил уже этой дорогой. И знает более короткий/удобный путь.
Сразу дисклайминг: всё нижеследующее - только идея, конструктивную критику за/против которой мне интересно получить. Я никого не призываю поступать именно так, мой интерес - сугубо академический. Ниже будет упоминаться se-standby - это не поддерживаемое вендором решение, а любой вариант получения-использования DR-env, подразумевающий копирование/синхронизацию/мирроринг данных коммерческих редакций oracle-субд продовых субд - должен быть пролицензирован.
В общем, вводная по use-case такова. Есть компания, с набором SE/SE2 баз. Баз достаточно много и они достаточно большие (по несколько терабайт каждая база), для ручного ведения тестовых баз от них, например, используя rman-бэкапы. Ещё важный момент: продовые бд - все названы одинаково (sid одинаковый). Информационные системы отстроены на использовании хранимок в продовых субд.
Соотв-но к этому и поэтому: существует большой набор plsql-разработчиков, поделённый на группы. С одной стороны: группы - работают с разными проектами, в разных стадиях работы с проектами, групп много, а с другой стороны - всё запихано в одних и тех же базах - группы работают практически с одними и теми же объектами бд и с разными целями этой работы, включая разрушающие тесты.
Такое бытие определяет потребности каждой группы в выделенной, для этой группы, тестовой бд. А то и: прямо для каждого разработчика.
Иначе говоря: бизнес-функциональные требования, по провиженингу тестовых баз такие:
Тестовых баз нужно много, потому что групп разработки много, десятки, а проектов - ещё больше. Провайдить тестовые базы нужно быстро, у разработки - свои сроки есть. Провайдить тестовые база - надо дёшево, по аппаратным ресурсам, человеко-часам.
Заранее не известно - от какой именно продовой бд потребуется слепить тестовую базу
Синтетическое наполнение тестовых бд данными - не подойдёт. Специфика проектов такая - либо пилят/перепиливают фичи к уже имеющемуся функционалу. А значит надо таблицы/данные/хранимки из продовой бд. А поскольку вся прикладная логика - в базе - там чёрт ногу сломит во взаимосвязях объектов возникает запрос: "мы не знаем что нам надо, сделай чтобы было всё. И актуальное."
Речь идёт о тестовых бд под функциональное тестирование.
Соответственно возникает инженерно-технический вопрос - как такое сделать. Лепить тестовые базы из рман-бэкапов продовых баз - ну, повторюсь, учитывая вводную на кол-во/размеры продовых баз и БФТ по работе с тестовыми базами - тут будут астрономического масштаба потребности в дисковых ёмкостях и человеко-часах, на такую деятельность.
Вариант с контейнерной бд - не подходит, SE-редакция и версия. Была бы EE и >=12.2: там можно до 4k подключаемых баз. Начиная с 18c сами подключаемые субд - лепить помощью снапшот-клонов.
Вариант с oracle-clonedb: тоже не подходит и тоже потому что SE;
Вариант проапгрейдить всё до 12.2 и EE - ну он есть конечно, в теории. На практике это вопросы к другим людям, не совсем, и совсем не к дба.
Для исходной ситуации попроще в природе есть такой вариант, для рапид/лоукост-провиженинга тестовых баз в SE-редакции:
От продовой SE-базы: по известной народной технологии, лепится
physical standbyбд, на отдельно стоящей виртуалке (дисклайминг про использование se-standby: в начале статьи).На этой, отдельно стоящей вм:
zfs, физ-компонента standby-бд - разворачивается в датасете, внутри zfs-пула. Пусть, условно, это путь/standbydbУ датасета: задано сжатие, это сильно экономит потребность в дисковой ёмкость, под физ-компоненту.В момент времени Ч: процесс актуализации standby-бд - останавливается.
От файловой системы, в которой живёт физ-компонента standby-бд: готовится cow-снапшот (snapshot+clon в терминах
zfs). Пусть cow-снапшот, условно, это путь/cowsnapshotЗапускается экземпляр субд, с отдельным файлом параметров, в котором, в качестве контрольника, указывается тот контрольник, который видно в
/cowsnapshotЗапущенный экземпляр - монтируется, с этого контрольника. Выполняется переименование датафайлов/логфайлов с путей в
/standbydbна пути в/cowsnapshotВыполняется смена
dbid, на какое то значение иdbname, ну пусть условно наtestdb1physical-standby - запускается и продолжает акутализироваться, уже, получается - как отдельный экземпляр.
Новая субд
testdb1, какими то скриптами, доводится от состояния побитовой копии продовой бд, к статусу тестовой бд.
Тут: всё прекрасно - бодро, экономно по дисковой ёмкости, просто. До тех пор пока хватает аппаратных ресурсов (прежде всего - память/цпу), вот на этой вм, на лепление/работу дополнительных тестовых баз, по этому сценарию, т.е.: testdb2, testdb3,... testdbN;
В ЕЕ - можно было бы, выкрутиться, в такой схеме и когда аппаратных ресурсов не хватает, а N - нужно делать ещё больше: cdb (тематический доклад с HL-конференции); Т.е.: поставить, на этой вм, контейнерную базу. И, после лепления очередной testdbN - не оставлять её, этуtestdbN, работать в виде стандалон-экземпляра, а заводить в контейнерную базу, в виде pdb; Тогда, на этой вм, по большому счёту, будут работать, постоянно, только две бд: вот эта physical standby,как само-осовременивающаяся копия продовой бд, конситетнтная/актуальная, и cdb; Ну и кратковременно - testdbN, в тот период времени когда её: уже создали, но ещё не завели в cdb, как pdb;
Но и этого, с момента времени когда dev-группы начнут требовать "а нам вчера нада базу от вот такого прода. сегодня - от другого. завтра от третьего", хватать перестанет - оно такого не обеспечит. Ибо, тут всё построено на наличии и использовании physical standby. А это - задаёт взаимно-однозначную связь между данной продовой бд и данной серверной площадкой, для лепления тестовых баз, от этой продовой бд. Т.е.: хочешь тестовых баз, от другой продовой бд - сделай такую же, отдельную, серверную площадку, с physical standby от этой продовой бд, cdb и прочее и прочее и прочее. Лепить несколько standby-баз, на этой площадке - не получится: и ресурсов быстро станет мало, и единая точка отказа, и, см. выше исходные: продовые бд, в этой компнии - все имеют одинаковое имя.
Т.е.: такое не подходит, под исходные БФТ данного юзекейса.
Ну и вот, тут, моя идея.
Берём какую то распределённую фс. Типа glusterfs, ceph; Пусть это будет ceph, мне он, в этом контексте, импонирует больше, возможностью подавать свои ресурсы на клиентские (по отношению к ceph-кластеру) вм в виде блочного устройства.
Как угодно, в этот ceph-кластер сливаем образы продовых бд. Ну, навскидку: создаём, в ceph-е, пул. В пуле, для каждой продовой бд: rbd-image, нужного размера. rbd-image - мапим, как дисковое уст-во, на какую то виртуалку(и), отдельной от продовой среды. Где разворачиваем, вот такой же народный se-standby, от данной продовой бд, а физ-компоненту этой standby-бд: заводим вот на это блочное уст-во, от ceph-а. Пусть, для определённости, здесь и далее это блочное устройство называется:
/dev/rbd0. Да, конечно: на этой, клиентской вм, сначала создаём какую то файловую систему, на этом/dev/rbd0монтируем её куда то, на этой вм. Потом лепим se-standby, с размещением её физ-компоненты в этой фс. Пусть, здесь и далее, такая вм называетсяdb;Т.о., в ceph-е, можно получить актуальные, консистентные и, что важно и приятно: само-акутализирующиеся, образы набора продовых баз. Можно и по другому как то, например инкрементально-обновляемые image-copy бэкапы. Тут не суть важно: как именно, допустим что есть такие образы баз в ceph-е.
Далее, готовится отдельная вм (здесь и далее:
devdb), под тестовую бд, от заданной продовой бд. В ceph-е, готовится клон, от данного пула/rbd-имиджа в котором расположена физ-компонента от standby-базы, данной продовой бд. Этот клон мапится наdebdbи становится там виден, как блочное устройство. Причём, на этом блочном уст-ве - уже есть файловая система, как итог действий на db-вм. Т.е., на стороне devdb-вм: просто монтируем это блочное устройство. Желательно в точку монтирования такую же как на db-вм, c которой, в ceph, в данный rbd-image ведётся физ-компонента standby-базы. Тогда - пути к датафайлам, на сторонеdevdbпод тестовую базу, получаться такие же, как пути к датафайлам, на стороне db-вм где живёт standby-бд.Ну. Собственно, всё: активировать, на стороне db-вм, образ standby-бд, доработать его скриптами, от фактического состояния побитовой копии прода, к статусу тестовой бд - спойлинг, перебивка паролей, режимов работы субд, обработка дблинок/джобов/acl-ей и прочее и прочее и прочее.
Собственно, пруф-оф-концепт я уже сделал. На oracle-xe базах, только standbу-базу не лепил, просто, на db-вм, расположил физ-компоненту субд в блочном устройстве поданном с ceph-а и остановил базу. Создал клон, от rbd-имиджа, в ceph-е, подал его, как блочное устройство на devdb-вм. Там замонтировал, в ту же точку монтирования. Запустил там xe-субд, с работой с образом базы, видимого через это блочное уст-во.
Запустилось, погонял SLOB-утилкой тесты. Работает.
Да тормозит, ибо - работа идёт не с локальным-честным дисковым устройством, а, с де-факто - сетевым ресурсом, мимикрирующим под блочное устройство.
Но тут: тоже нашёлся вариант Open CAS - несколько выправляет ситуацию; Т.е., можно сделать типа вот так:
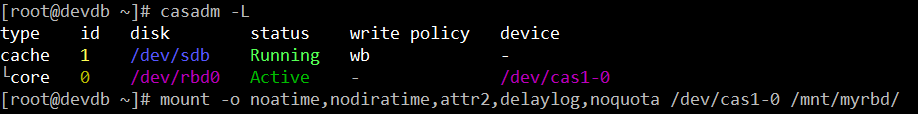
Здесь /dev/sdb - локальное-честное дисковое уст-во, devdb-вм, выступающее как кеш-девайс, для io с/на бакэнд-девайс (core-девайс, в терминах opencas) /dev/rbd0; wb: writeback-мода; Потестил, при прочих равных, с работой xe-субд, с образом бд на, непосредственно, /dev/rbd0;
Cтатспак-отчёт, для этого теста.
STATSPACK report for
Database DB Id Instance Inst Num Startup Time Release RAC
~~~~~~~~ ----------- ------------ -------- --------------- ----------- ---
2945358617 XE 1 12-Feb-21 18:26 11.2.0.2.0 NO
Host Name Platform CPUs Cores Sockets Memory (G)
~~~~ ---------------- ---------------------- ----- ----- ------- ------------
devdb Linux x86 64-bit 4 2 1 7.6
Snapshot Snap Id Snap Time Sessions Curs/Sess Comment
~~~~~~~~ ---------- ------------------ -------- --------- ------------------
Begin Snap: 13 12-Feb-21 19:08:41 34 1.8
End Snap: 14 12-Feb-21 19:13:45 24 1.3
Elapsed: 5.07 (mins) Av Act Sess: 8.8
DB time: 44.80 (mins) DB CPU: 0.31 (mins)
Cache Sizes Begin End
~~~~~~~~~~~ ---------- ----------
Buffer Cache: 424M Std Block Size: 8K
Shared Pool: 168M Log Buffer: 5,148K
Load Profile Per Second Per Transaction Per Exec Per Call
~~~~~~~~~~~~ ------------------ ----------------- ----------- -----------
DB time(s): 8.8 17.5 0.66 53.76
DB CPU(s): 0.1 0.1 0.00 0.37
Redo size: 32,571.0 64,296.1
Logical reads: 13,168.2 25,994.4
Block changes: 74.0 146.1
Physical reads: 13,039.7 25,740.8
Physical writes: 28.7 56.7
User calls: 0.2 0.3
Parses: 0.3 0.6
Hard parses: 0.0 0.0
W/A MB processed: 0.1 0.1
Logons: 0.0 0.0
Executes: 13.5 26.6
Rollbacks: 0.0 0.0
Transactions: 0.5
Instance Efficiency Indicators
~~~~~~~~~~~~~~~~~~~~~~~~~~~~~~
Buffer Nowait %: 100.00 Redo NoWait %: 100.00
Buffer Hit %: 26.55 Optimal W/A Exec %: 100.00
Library Hit %: 100.00 Soft Parse %: 100.00
Execute to Parse %: 97.60 Latch Hit %: 99.99
Parse CPU to Parse Elapsd %: 0.00 % Non-Parse CPU: 100.00
Shared Pool Statistics Begin End
------ ------
Memory Usage %: 86.27 85.77
% SQL with executions>1: 76.71 75.29
% Memory for SQL w/exec>1: 81.30 80.15
Top 5 Timed Events Avg %Total
~~~~~~~~~~~~~~~~~~ wait Call
Event Waits Time (s) (ms) Time
----------------------------------------- ------------ ----------- ------ ------
db file sequential read 91,396 1,605 18 59.4
direct path read 60,032 1,031 17 38.2
db file parallel read 650 19 29 .7
CPU time 18 .7
resmgr:cpu quantum 5,969 12 2 .4
-------------------------------------------------------------
Host CPU (CPUs: 4 Cores: 2 Sockets: 1)
~~~~~~~~ Load Average
Begin End User System Idle WIO WCPU
------- ------- ------- ------- ------- ------- --------
3.09 3.51 0.58 3.29 95.85 68.88
Instance CPU
~~~~~~~~~~~~ % Time (seconds)
-------- --------------
Host: Total time (s): 1,170.2
Host: Busy CPU time (s): 48.5
% of time Host is Busy: 4.1
Instance: Total CPU time (s): 18.7
% of Busy CPU used for Instance: 38.6
Instance: Total Database time (s): 2,704.2
%DB time waiting for CPU (Resource Mgr): 0.0
Virtual Memory Paging
~~~~~~~~~~~~~~~~~~~~~
KB paged out per sec: 264.0
KB paged in per sec: 103,847.6
Memory Statistics Begin End
~~~~~~~~~~~~~~~~~ ------------ ------------
Host Mem (MB): 7,812.1 7,812.1
SGA use (MB): 1,019.4 1,019.4
PGA use (MB): 109.2 60.7
% Host Mem used for SGA+PGA: 14.4 13.8
-------------------------------------------------------------
Time Model System Stats DB/Inst: XE/XE Snaps: 13-14
-> Ordered by % of DB time desc, Statistic name
Statistic Time (s) % DB time
----------------------------------- -------------------- ---------
sql execute elapsed time 2,687.8 100.0
DB CPU 18.3 .7
PL/SQL execution elapsed time 0.1 .0
connection management call elapsed 0.0 .0
parse time elapsed 0.0 .0
DB time 2,687.9
background elapsed time 16.4
background cpu time 0.4
-------------------------------------------------------------
Foreground Wait Events DB/Inst: XE/XE Snaps: 13-14
-> Only events with Total Wait Time (s) >= .001 are shown
-> ordered by Total Wait Time desc, Waits desc (idle events last)
Avg %Total
%Tim Total Wait wait Waits Call
Event Waits out Time (s) (ms) /txn Time
---------------------------- ------------ ---- ---------- ------ -------- ------
db file sequential read 91,396 0 1,605 18 593.5 59.4
direct path read 60,032 0 1,031 17 389.8 38.2
db file parallel read 650 0 19 29 4.2 .7
resmgr:cpu quantum 5,969 0 12 2 38.8 .4
control file sequential read 340 0 1 2 2.2 .0
log file sync 2 0 0 18 0.0 .0
asynch descriptor resize 2,339 100 0 0 15.2 .0
SQL*Net message from client 33 0 0 0 0.2
-------------------------------------------------------------
Background Wait Events DB/Inst: XE/XE Snaps: 13-14
-> Only events with Total Wait Time (s) >= .001 are shown
-> ordered by Total Wait Time desc, Waits desc (idle events last)
Avg %Total
%Tim Total Wait wait Waits Call
Event Waits out Time (s) (ms) /txn Time
---------------------------- ------------ ---- ---------- ------ -------- ------
db file parallel write 777 0 6 7 5.0 .2
log file parallel write 188 0 4 19 1.2 .1
control file sequential read 172 0 3 20 1.1 .1
control file parallel write 99 0 2 22 0.6 .1
rdbms ipc message 1,385 87 3,012 2174 9.0
shared server idle wait 40 100 1,200 30009 0.3
Space Manager: slave idle wa 122 100 610 5000 0.8
DIAG idle wait 606 100 606 1000 3.9
Streams AQ: qmn coordinator 22 50 308 14005 0.1
Streams AQ: qmn slave idle w 11 0 308 28009 0.1
pmon timer 99 101 300 3033 0.6
dispatcher timer 5 100 300 60011 0.0
smon timer 1 100 300 ###### 0.0
SQL*Net message from client 14 0 0 0 0.1
-------------------------------------------------------------
Wait Events (fg and bg) DB/Inst: XE/XE Snaps: 13-14
-> s - second, cs - centisecond, ms - millisecond, us - microsecond
-> %Timeouts: value of 0 indicates value was < .5%. Value of null is truly 0
-> Only events with Total Wait Time (s) >= .001 are shown
-> ordered by Total Wait Time desc, Waits desc (idle events last)
Avg %Total
%Tim Total Wait wait Waits Call
Event Waits out Time (s) (ms) /txn Time
---------------------------- ------------ ---- ---------- ------ -------- ------
db file sequential read 91,396 0 1,605 18 593.5 59.4
direct path read 60,032 0 1,031 17 389.8 38.2
db file parallel read 650 0 19 29 4.2 .7
resmgr:cpu quantum 5,969 0 12 2 38.8 .4
db file parallel write 777 0 6 7 5.0 .2
control file sequential read 512 0 4 8 3.3 .1
log file parallel write 188 0 4 19 1.2 .1
control file parallel write 99 0 2 22 0.6 .1
log file sync 2 0 0 18 0.0 .0
asynch descriptor resize 2,340 100 0 0 15.2 .0
rdbms ipc message 1,385 87 3,012 2174 9.0
shared server idle wait 40 100 1,200 30009 0.3
Space Manager: slave idle wa 122 100 610 5000 0.8
DIAG idle wait 606 100 606 1000 3.9
Streams AQ: qmn coordinator 22 50 308 14005 0.1
Streams AQ: qmn slave idle w 11 0 308 28009 0.1
pmon timer 99 101 300 3033 0.6
dispatcher timer 5 100 300 60011 0.0
smon timer 1 100 300 ###### 0.0
SQL*Net message from client 47 0 0 0 0.3
-------------------------------------------------------------
Wait Event Histogram DB/Inst: XE/XE Snaps: 13-14
-> Total Waits - units: K is 1000, M is 1000000, G is 1000000000
-> % of Waits - column heading: <=1s is truly <1024ms, >1s is truly >=1024ms
-> % of Waits - value: .0 indicates value was <.05%, null is truly 0
-> Ordered by Event (idle events last)
Total ----------------- % of Waits ------------------
Event Waits <1ms <2ms <4ms <8ms <16ms <32ms <=1s >1s
-------------------------- ----- ----- ----- ----- ----- ----- ----- ----- -----
Disk file operations I/O 4 100.0
LGWR wait for redo copy 1 100.0
asynch descriptor resize 2340 100.0
control file parallel writ 99 35.4 6.1 12.1 27.3 19.2
control file sequential re 512 74.6 2.3 .4 .2 3.7 8.2 10.5
db file parallel read 650 .5 1.1 1.4 3.1 13.5 42.2 38.3
db file parallel write 775 33.7 7.6 12.1 14.8 16.9 11.2 3.6
db file sequential read 91K 10.1 22.3 3.0 2.9 14.8 27.5 19.3
direct path read 60K 1.1 .2 .8 12.8 43.9 28.9 12.3
latch: In memory undo latc 3 100.0
log file parallel write 188 14.9 31.9 15.4 16.5 21.3
log file sync 2 50.0 50.0
resmgr:cpu quantum 5965 69.9 3.1 7.4 14.6 4.0 .5 .4
DIAG idle wait 606 100.0
SQL*Net message from clien 47 95.7 4.3
SQL*Net message to client 46 100.0
Space Manager: slave idle 122 100.0
Streams AQ: qmn coordinato 22 50.0 50.0
Streams AQ: qmn slave idle 11 100.0
dispatcher timer 5 100.0
pmon timer 100 100.0
rdbms ipc message 1385 .6 .1 .1 .1 .6 32.9 65.5
shared server idle wait 40 100.0
smon timer 1 100.0
-------------------------------------------------------------
SQL ordered by CPU DB/Inst: XE/XE Snaps: 13-14
-> Total DB CPU (s): 18
-> Captured SQL accounts for 196.0% of Total DB CPU
-> SQL reported below exceeded 1.0% of Total DB CPU
CPU CPU per Elapsd Old
Time (s) Executions Exec (s) %Total Time (s) Buffer Gets Hash Value
---------- ------------ ---------- ------ ---------- --------------- ----------
9.53 1,872 0.01 52.0 1047.76 3,847,673 2922983071
Module: SQL*Plus
SELECT COUNT(C2) FROM CF2
7.32 1,906 0.00 39.9 1511.20 124,514 1900182548
Module: SQL*Plus
SELECT COUNT(C2) FROM CF1 WHERE ( CUSTID > ( :B1 - :B2 ) ) AND (
CUSTID < :B1 )
2.81 1 2.81 15.3 268.97 873,550 3562924056
Module: SQL*Plus
DECLARE v_default_schema_number PLS_INTEGER := '1'; v_update_pct
PLS_INTEGER := '4'; v_max_loop_iterations PLS_INTEGER := '0'; v
_seconds_to_run PLS_INTEGER := '300'; v_scale PLS_INTEGER := '32
768'; v_work_unit PLS_INTEGER := '64' ; v_redo_stress VARCHAR2(
1.80 1 1.80 9.8 268.95 371,759 2294594620
Module: SQL*Plus
DECLARE v_default_schema_number PLS_INTEGER := '5'; v_update_pct
PLS_INTEGER := '4'; v_max_loop_iterations PLS_INTEGER := '0'; v
_seconds_to_run PLS_INTEGER := '300'; v_scale PLS_INTEGER := '32
768'; v_work_unit PLS_INTEGER := '64' ; v_redo_stress VARCHAR2(
1.76 1 1.76 9.6 268.86 371,614 1815383075
Module: SQL*Plus
DECLARE v_default_schema_number PLS_INTEGER := '9'; v_update_pct
PLS_INTEGER := '4'; v_max_loop_iterations PLS_INTEGER := '0'; v
_seconds_to_run PLS_INTEGER := '300'; v_scale PLS_INTEGER := '32
768'; v_work_unit PLS_INTEGER := '64' ; v_redo_stress VARCHAR2(
1.74 1 1.74 9.5 268.42 363,476 1410152490
Module: SQL*Plus
DECLARE v_default_schema_number PLS_INTEGER := '4'; v_update_pct
PLS_INTEGER := '4'; v_max_loop_iterations PLS_INTEGER := '0'; v
_seconds_to_run PLS_INTEGER := '300'; v_scale PLS_INTEGER := '32
768'; v_work_unit PLS_INTEGER := '64' ; v_redo_stress VARCHAR2(
1.70 1 1.70 9.2 269.01 357,436 3704050312
Module: SQL*Plus
DECLARE v_default_schema_number PLS_INTEGER := '8'; v_update_pct
PLS_INTEGER := '4'; v_max_loop_iterations PLS_INTEGER := '0'; v
_seconds_to_run PLS_INTEGER := '300'; v_scale PLS_INTEGER := '32
768'; v_work_unit PLS_INTEGER := '64' ; v_redo_stress VARCHAR2(
1.68 1 1.68 9.1 268.07 352,430 203624297
Module: SQL*Plus
DECLARE v_default_schema_number PLS_INTEGER := '7'; v_update_pct
PLS_INTEGER := '4'; v_max_loop_iterations PLS_INTEGER := '0'; v
_seconds_to_run PLS_INTEGER := '300'; v_scale PLS_INTEGER := '32
768'; v_work_unit PLS_INTEGER := '64' ; v_redo_stress VARCHAR2(
1.65 1 1.65 9.0 267.82 337,416 2698804698
SQL ordered by CPU DB/Inst: XE/XE Snaps: 13-14
-> Total DB CPU (s): 18
-> Captured SQL accounts for 196.0% of Total DB CPU
-> SQL reported below exceeded 1.0% of Total DB CPU
CPU CPU per Elapsd Old
Time (s) Executions Exec (s) %Total Time (s) Buffer Gets Hash Value
---------- ------------ ---------- ------ ---------- --------------- ----------
Module: SQL*Plus
DECLARE v_default_schema_number PLS_INTEGER := '10'; v_update_pc
t PLS_INTEGER := '4'; v_max_loop_iterations PLS_INTEGER := '0';
v_seconds_to_run PLS_INTEGER := '300'; v_scale PLS_INTEGER := '3
2768'; v_work_unit PLS_INTEGER := '64' ; v_redo_stress VARCHAR2
1.63 1 1.63 8.9 268.16 331,738 3879266389
Module: SQL*Plus
DECLARE v_default_schema_number PLS_INTEGER := '6'; v_update_pct
PLS_INTEGER := '4'; v_max_loop_iterations PLS_INTEGER := '0'; v
_seconds_to_run PLS_INTEGER := '300'; v_scale PLS_INTEGER := '32
768'; v_work_unit PLS_INTEGER := '64' ; v_redo_stress VARCHAR2(
1.60 1 1.60 8.7 269.00 327,016 3125669980
Module: SQL*Plus
DECLARE v_default_schema_number PLS_INTEGER := '2'; v_update_pct
PLS_INTEGER := '4'; v_max_loop_iterations PLS_INTEGER := '0'; v
_seconds_to_run PLS_INTEGER := '300'; v_scale PLS_INTEGER := '32
768'; v_work_unit PLS_INTEGER := '64' ; v_redo_stress VARCHAR2(
1.57 1 1.57 8.6 268.11 317,989 72207027
Module: SQL*Plus
DECLARE v_default_schema_number PLS_INTEGER := '3'; v_update_pct
PLS_INTEGER := '4'; v_max_loop_iterations PLS_INTEGER := '0'; v
_seconds_to_run PLS_INTEGER := '300'; v_scale PLS_INTEGER := '32
768'; v_work_unit PLS_INTEGER := '64' ; v_redo_stress VARCHAR2(
0.78 152 0.01 4.2 118.58 11,041 789159957
Module: SQL*Plus
UPDATE CF1 SET C2 = :B3 , C20 = :B3 WHERE ( CUSTID > ( :B1 - :B2
)) AND (CUSTID < :B1 )
0.38 1 0.38 2.1 2.42 3,171 588252891
Module: SQL*Plus
BEGIN :SNAP := STATSPACK.SNAP; END;
-------------------------------------------------------------
SQL ordered by Elapsed time for DB: XE Instance: XE Snaps: 13 -14
-> Total DB Time (s): 2,688
-> Captured SQL accounts for 199.6% of Total DB Time
-> SQL reported below exceeded 1.0% of Total DB Time
Elapsed Elap per CPU Old
Time (s) Executions Exec (s) %Total Time (s) Physical Reads Hash Value
---------- ------------ ---------- ------ ---------- --------------- ----------
1511.20 1,906 0.79 56.2 7.32 98,887 1900182548
Module: SQL*Plus
SELECT COUNT(C2) FROM CF1 WHERE ( CUSTID > ( :B1 - :B2 ) ) AND (
CUSTID < :B1 )
1047.76 1,872 0.56 39.0 9.53 3,842,048 2922983071
Module: SQL*Plus
SELECT COUNT(C2) FROM CF2
269.01 1 269.01 10.0 1.70 354,796 3704050312
Module: SQL*Plus
DECLARE v_default_schema_number PLS_INTEGER := '8'; v_update_pct
PLS_INTEGER := '4'; v_max_loop_iterations PLS_INTEGER := '0'; v
_seconds_to_run PLS_INTEGER := '300'; v_scale PLS_INTEGER := '32
768'; v_work_unit PLS_INTEGER := '64' ; v_redo_stress VARCHAR2(
269.00 1 269.00 10.0 1.60 324,997 3125669980
Module: SQL*Plus
DECLARE v_default_schema_number PLS_INTEGER := '2'; v_update_pct
PLS_INTEGER := '4'; v_max_loop_iterations PLS_INTEGER := '0'; v
_seconds_to_run PLS_INTEGER := '300'; v_scale PLS_INTEGER := '32
768'; v_work_unit PLS_INTEGER := '64' ; v_redo_stress VARCHAR2(
268.97 1 268.97 10.0 2.81 859,964 3562924056
Module: SQL*Plus
DECLARE v_default_schema_number PLS_INTEGER := '1'; v_update_pct
PLS_INTEGER := '4'; v_max_loop_iterations PLS_INTEGER := '0'; v
_seconds_to_run PLS_INTEGER := '300'; v_scale PLS_INTEGER := '32
768'; v_work_unit PLS_INTEGER := '64' ; v_redo_stress VARCHAR2(
268.95 1 268.95 10.0 1.80 368,875 2294594620
Module: SQL*Plus
DECLARE v_default_schema_number PLS_INTEGER := '5'; v_update_pct
PLS_INTEGER := '4'; v_max_loop_iterations PLS_INTEGER := '0'; v
_seconds_to_run PLS_INTEGER := '300'; v_scale PLS_INTEGER := '32
768'; v_work_unit PLS_INTEGER := '64' ; v_redo_stress VARCHAR2(
268.86 1 268.86 10.0 1.76 368,679 1815383075
Module: SQL*Plus
DECLARE v_default_schema_number PLS_INTEGER := '9'; v_update_pct
PLS_INTEGER := '4'; v_max_loop_iterations PLS_INTEGER := '0'; v
_seconds_to_run PLS_INTEGER := '300'; v_scale PLS_INTEGER := '32
768'; v_work_unit PLS_INTEGER := '64' ; v_redo_stress VARCHAR2(
268.42 1 268.42 10.0 1.74 360,329 1410152490
Module: SQL*Plus
DECLARE v_default_schema_number PLS_INTEGER := '4'; v_update_pct
PLS_INTEGER := '4'; v_max_loop_iterations PLS_INTEGER := '0'; v
_seconds_to_run PLS_INTEGER := '300'; v_scale PLS_INTEGER := '32
768'; v_work_unit PLS_INTEGER := '64' ; v_redo_stress VARCHAR2(
268.16 1 268.16 10.0 1.63 329,464 3879266389
SQL ordered by Elapsed time for DB: XE Instance: XE Snaps: 13 -14
-> Total DB Time (s): 2,688
-> Captured SQL accounts for 199.6% of Total DB Time
-> SQL reported below exceeded 1.0% of Total DB Time
Elapsed Elap per CPU Old
Time (s) Executions Exec (s) %Total Time (s) Physical Reads Hash Value
---------- ------------ ---------- ------ ---------- --------------- ----------
Module: SQL*Plus
DECLARE v_default_schema_number PLS_INTEGER := '6'; v_update_pct
PLS_INTEGER := '4'; v_max_loop_iterations PLS_INTEGER := '0'; v
_seconds_to_run PLS_INTEGER := '300'; v_scale PLS_INTEGER := '32
768'; v_work_unit PLS_INTEGER := '64' ; v_redo_stress VARCHAR2(
268.11 1 268.11 10.0 1.57 316,193 72207027
Module: SQL*Plus
DECLARE v_default_schema_number PLS_INTEGER := '3'; v_update_pct
PLS_INTEGER := '4'; v_max_loop_iterations PLS_INTEGER := '0'; v
_seconds_to_run PLS_INTEGER := '300'; v_scale PLS_INTEGER := '32
768'; v_work_unit PLS_INTEGER := '64' ; v_redo_stress VARCHAR2(
268.07 1 268.07 10.0 1.68 349,745 203624297
Module: SQL*Plus
DECLARE v_default_schema_number PLS_INTEGER := '7'; v_update_pct
PLS_INTEGER := '4'; v_max_loop_iterations PLS_INTEGER := '0'; v
_seconds_to_run PLS_INTEGER := '300'; v_scale PLS_INTEGER := '32
768'; v_work_unit PLS_INTEGER := '64' ; v_redo_stress VARCHAR2(
267.82 1 267.82 10.0 1.65 335,483 2698804698
Module: SQL*Plus
DECLARE v_default_schema_number PLS_INTEGER := '10'; v_update_pc
t PLS_INTEGER := '4'; v_max_loop_iterations PLS_INTEGER := '0';
v_seconds_to_run PLS_INTEGER := '300'; v_scale PLS_INTEGER := '3
2768'; v_work_unit PLS_INTEGER := '64' ; v_redo_stress VARCHAR2
118.58 152 0.78 4.4 0.78 7,419 789159957
Module: SQL*Plus
UPDATE CF1 SET C2 = :B3 , C20 = :B3 WHERE ( CUSTID > ( :B1 - :B2
)) AND (CUSTID < :B1 )
-------------------------------------------------------------
SQL ordered by Gets DB/Inst: XE/XE Snaps: 13-14
-> End Buffer Gets Threshold: 10000 Total Buffer Gets: 4,003,140
-> Captured SQL accounts for 99.5% of Total Buffer Gets
-> SQL reported below exceeded 1.0% of Total Buffer Gets
CPU Elapsd Old
Buffer Gets Executions Gets per Exec %Total Time (s) Time (s) Hash Value
--------------- ------------ -------------- ------ -------- --------- ----------
3,847,673 1,872 2,055.4 ###### 9.53 1047.76 2922983071
Module: SQL*Plus
SELECT COUNT(C2) FROM CF2
873,550 1 873,550.0 601.1 2.81 268.97 3562924056
Module: SQL*Plus
DECLARE v_default_schema_number PLS_INTEGER := '1'; v_update_pct
PLS_INTEGER := '4'; v_max_loop_iterations PLS_INTEGER := '0'; v
_seconds_to_run PLS_INTEGER := '300'; v_scale PLS_INTEGER := '32
768'; v_work_unit PLS_INTEGER := '64' ; v_redo_stress VARCHAR2(
371,759 1 371,759.0 255.8 1.80 268.95 2294594620
Module: SQL*Plus
DECLARE v_default_schema_number PLS_INTEGER := '5'; v_update_pct
PLS_INTEGER := '4'; v_max_loop_iterations PLS_INTEGER := '0'; v
_seconds_to_run PLS_INTEGER := '300'; v_scale PLS_INTEGER := '32
768'; v_work_unit PLS_INTEGER := '64' ; v_redo_stress VARCHAR2(
371,614 1 371,614.0 255.7 1.76 268.86 1815383075
Module: SQL*Plus
DECLARE v_default_schema_number PLS_INTEGER := '9'; v_update_pct
PLS_INTEGER := '4'; v_max_loop_iterations PLS_INTEGER := '0'; v
_seconds_to_run PLS_INTEGER := '300'; v_scale PLS_INTEGER := '32
768'; v_work_unit PLS_INTEGER := '64' ; v_redo_stress VARCHAR2(
363,476 1 363,476.0 250.1 1.74 268.42 1410152490
Module: SQL*Plus
DECLARE v_default_schema_number PLS_INTEGER := '4'; v_update_pct
PLS_INTEGER := '4'; v_max_loop_iterations PLS_INTEGER := '0'; v
_seconds_to_run PLS_INTEGER := '300'; v_scale PLS_INTEGER := '32
768'; v_work_unit PLS_INTEGER := '64' ; v_redo_stress VARCHAR2(
357,436 1 357,436.0 246.0 1.70 269.01 3704050312
Module: SQL*Plus
DECLARE v_default_schema_number PLS_INTEGER := '8'; v_update_pct
PLS_INTEGER := '4'; v_max_loop_iterations PLS_INTEGER := '0'; v
_seconds_to_run PLS_INTEGER := '300'; v_scale PLS_INTEGER := '32
768'; v_work_unit PLS_INTEGER := '64' ; v_redo_stress VARCHAR2(
352,430 1 352,430.0 242.5 1.68 268.07 203624297
Module: SQL*Plus
DECLARE v_default_schema_number PLS_INTEGER := '7'; v_update_pct
PLS_INTEGER := '4'; v_max_loop_iterations PLS_INTEGER := '0'; v
_seconds_to_run PLS_INTEGER := '300'; v_scale PLS_INTEGER := '32
768'; v_work_unit PLS_INTEGER := '64' ; v_redo_stress VARCHAR2(
337,416 1 337,416.0 232.2 1.65 267.82 2698804698
Module: SQL*Plus
DECLARE v_default_schema_number PLS_INTEGER := '10'; v_update_pc
t PLS_INTEGER := '4'; v_max_loop_iterations PLS_INTEGER := '0';
v_seconds_to_run PLS_INTEGER := '300'; v_scale PLS_INTEGER := '3
2768'; v_work_unit PLS_INTEGER := '64' ; v_redo_stress VARCHAR2
SQL ordered by Gets DB/Inst: XE/XE Snaps: 13-14
-> End Buffer Gets Threshold: 10000 Total Buffer Gets: 4,003,140
-> Captured SQL accounts for 99.5% of Total Buffer Gets
-> SQL reported below exceeded 1.0% of Total Buffer Gets
CPU Elapsd Old
Buffer Gets Executions Gets per Exec %Total Time (s) Time (s) Hash Value
--------------- ------------ -------------- ------ -------- --------- ----------
331,738 1 331,738.0 228.3 1.63 268.16 3879266389
Module: SQL*Plus
DECLARE v_default_schema_number PLS_INTEGER := '6'; v_update_pct
PLS_INTEGER := '4'; v_max_loop_iterations PLS_INTEGER := '0'; v
_seconds_to_run PLS_INTEGER := '300'; v_scale PLS_INTEGER := '32
768'; v_work_unit PLS_INTEGER := '64' ; v_redo_stress VARCHAR2(
327,016 1 327,016.0 225.0 1.60 269.00 3125669980
Module: SQL*Plus
DECLARE v_default_schema_number PLS_INTEGER := '2'; v_update_pct
PLS_INTEGER := '4'; v_max_loop_iterations PLS_INTEGER := '0'; v
_seconds_to_run PLS_INTEGER := '300'; v_scale PLS_INTEGER := '32
768'; v_work_unit PLS_INTEGER := '64' ; v_redo_stress VARCHAR2(
317,989 1 317,989.0 218.8 1.57 268.11 72207027
Module: SQL*Plus
DECLARE v_default_schema_number PLS_INTEGER := '3'; v_update_pct
PLS_INTEGER := '4'; v_max_loop_iterations PLS_INTEGER := '0'; v
_seconds_to_run PLS_INTEGER := '300'; v_scale PLS_INTEGER := '32
768'; v_work_unit PLS_INTEGER := '64' ; v_redo_stress VARCHAR2(
124,514 1,906 65.3 85.7 7.32 1511.20 1900182548
Module: SQL*Plus
SELECT COUNT(C2) FROM CF1 WHERE ( CUSTID > ( :B1 - :B2 ) ) AND (
CUSTID < :B1 )
-------------------------------------------------------------
SQL ordered by Reads DB/Inst: XE/XE Snaps: 13-14
-> End Disk Reads Threshold: 1000 Total Disk Reads: 3,964,080
-> Captured SQL accounts for 99.6% of Total Disk Reads
-> SQL reported below exceeded 1.0% of Total Disk Reads
CPU Elapsd
Physical Rds Executions Rds per Exec %Total Time (s) Time (s) Hash Value
--------------- ------------ -------------- ------ -------- --------- ----------
3,842,048 1,872 2,052.4 96.9 9.53 1047.76 2922983071
Module: SQL*Plus
SELECT COUNT(C2) FROM CF2
859,964 1 859,964.0 21.7 2.81 268.97 3562924056
Module: SQL*Plus
DECLARE v_default_schema_number PLS_INTEGER := '1'; v_update_pct
PLS_INTEGER := '4'; v_max_loop_iterations PLS_INTEGER := '0'; v
_seconds_to_run PLS_INTEGER := '300'; v_scale PLS_INTEGER := '32
768'; v_work_unit PLS_INTEGER := '64' ; v_redo_stress VARCHAR2(
368,875 1 368,875.0 9.3 1.80 268.95 2294594620
Module: SQL*Plus
DECLARE v_default_schema_number PLS_INTEGER := '5'; v_update_pct
PLS_INTEGER := '4'; v_max_loop_iterations PLS_INTEGER := '0'; v
_seconds_to_run PLS_INTEGER := '300'; v_scale PLS_INTEGER := '32
768'; v_work_unit PLS_INTEGER := '64' ; v_redo_stress VARCHAR2(
368,679 1 368,679.0 9.3 1.76 268.86 1815383075
Module: SQL*Plus
DECLARE v_default_schema_number PLS_INTEGER := '9'; v_update_pct
PLS_INTEGER := '4'; v_max_loop_iterations PLS_INTEGER := '0'; v
_seconds_to_run PLS_INTEGER := '300'; v_scale PLS_INTEGER := '32
768'; v_work_unit PLS_INTEGER := '64' ; v_redo_stress VARCHAR2(
360,329 1 360,329.0 9.1 1.74 268.42 1410152490
Module: SQL*Plus
DECLARE v_default_schema_number PLS_INTEGER := '4'; v_update_pct
PLS_INTEGER := '4'; v_max_loop_iterations PLS_INTEGER := '0'; v
_seconds_to_run PLS_INTEGER := '300'; v_scale PLS_INTEGER := '32
768'; v_work_unit PLS_INTEGER := '64' ; v_redo_stress VARCHAR2(
354,796 1 354,796.0 9.0 1.70 269.01 3704050312
Module: SQL*Plus
DECLARE v_default_schema_number PLS_INTEGER := '8'; v_update_pct
PLS_INTEGER := '4'; v_max_loop_iterations PLS_INTEGER := '0'; v
_seconds_to_run PLS_INTEGER := '300'; v_scale PLS_INTEGER := '32
768'; v_work_unit PLS_INTEGER := '64' ; v_redo_stress VARCHAR2(
349,745 1 349,745.0 8.8 1.68 268.07 203624297
Module: SQL*Plus
DECLARE v_default_schema_number PLS_INTEGER := '7'; v_update_pct
PLS_INTEGER := '4'; v_max_loop_iterations PLS_INTEGER := '0'; v
_seconds_to_run PLS_INTEGER := '300'; v_scale PLS_INTEGER := '32
768'; v_work_unit PLS_INTEGER := '64' ; v_redo_stress VARCHAR2(
335,483 1 335,483.0 8.5 1.65 267.82 2698804698
Module: SQL*Plus
DECLARE v_default_schema_number PLS_INTEGER := '10'; v_update_pc
t PLS_INTEGER := '4'; v_max_loop_iterations PLS_INTEGER := '0';
v_seconds_to_run PLS_INTEGER := '300'; v_scale PLS_INTEGER := '3
2768'; v_work_unit PLS_INTEGER := '64' ; v_redo_stress VARCHAR2
SQL ordered by Reads DB/Inst: XE/XE Snaps: 13-14
-> End Disk Reads Threshold: 1000 Total Disk Reads: 3,964,080
-> Captured SQL accounts for 99.6% of Total Disk Reads
-> SQL reported below exceeded 1.0% of Total Disk Reads
CPU Elapsd
Physical Rds Executions Rds per Exec %Total Time (s) Time (s) Hash Value
--------------- ------------ -------------- ------ -------- --------- ----------
329,464 1 329,464.0 8.3 1.63 268.16 3879266389
Module: SQL*Plus
DECLARE v_default_schema_number PLS_INTEGER := '6'; v_update_pct
PLS_INTEGER := '4'; v_max_loop_iterations PLS_INTEGER := '0'; v
_seconds_to_run PLS_INTEGER := '300'; v_scale PLS_INTEGER := '32
768'; v_work_unit PLS_INTEGER := '64' ; v_redo_stress VARCHAR2(
324,997 1 324,997.0 8.2 1.60 269.00 3125669980
Module: SQL*Plus
DECLARE v_default_schema_number PLS_INTEGER := '2'; v_update_pct
PLS_INTEGER := '4'; v_max_loop_iterations PLS_INTEGER := '0'; v
_seconds_to_run PLS_INTEGER := '300'; v_scale PLS_INTEGER := '32
768'; v_work_unit PLS_INTEGER := '64' ; v_redo_stress VARCHAR2(
316,193 1 316,193.0 8.0 1.57 268.11 72207027
Module: SQL*Plus
DECLARE v_default_schema_number PLS_INTEGER := '3'; v_update_pct
PLS_INTEGER := '4'; v_max_loop_iterations PLS_INTEGER := '0'; v
_seconds_to_run PLS_INTEGER := '300'; v_scale PLS_INTEGER := '32
768'; v_work_unit PLS_INTEGER := '64' ; v_redo_stress VARCHAR2(
98,887 1,906 51.9 2.5 7.32 1511.20 1900182548
Module: SQL*Plus
SELECT COUNT(C2) FROM CF1 WHERE ( CUSTID > ( :B1 - :B2 ) ) AND (
CUSTID < :B1 )
-------------------------------------------------------------
SQL ordered by Executions DB/Inst: XE/XE Snaps: 13-14
-> End Executions Threshold: 100 Total Executions: 4,091
-> Captured SQL accounts for 96.6% of Total Executions
-> SQL reported below exceeded 1.0% of Total Executions
CPU per Elap per Old
Executions Rows Processed Rows per Exec Exec (s) Exec (s) Hash Value
------------ --------------- ---------------- ----------- ---------- ----------
1,906 1,912 1.0 0.00 0.79 1900182548
Module: SQL*Plus
SELECT COUNT(C2) FROM CF1 WHERE ( CUSTID > ( :B1 - :B2 ) ) AND (
CUSTID < :B1 )
1,872 1,876 1.0 0.01 0.56 2922983071
Module: SQL*Plus
SELECT COUNT(C2) FROM CF2
152 9,576 63.0 0.01 0.78 789159957
Module: SQL*Plus
UPDATE CF1 SET C2 = :B3 , C20 = :B3 WHERE ( CUSTID > ( :B1 - :B2
)) AND (CUSTID < :B1 )
-------------------------------------------------------------
SQL ordered by Parse Calls DB/Inst: XE/XE Snaps: 13-14
-> End Parse Calls Threshold: 1000 Total Parse Calls: 98
-> Captured SQL accounts for 13.3% of Total Parse Calls
-> SQL reported below exceeded 1.0% of Total Parse Calls
% Total Old
Parse Calls Executions Parses Hash Value
------------ ------------ -------- ----------
10 10 10.20 1307714173
Module: SQL*Plus
BEGIN DBMS_OUTPUT.GET_LINES(:LINES, :NUMLINES); END;
2 2 2.04 2275360153
select /*+ connect_by_filtering */ privilege#,level from sysauth
$ connect by grantee#=prior privilege# and privilege#>0 start wi
th grantee#=:1 and privilege#>0
1 1 1.02 588252891
Module: SQL*Plus
BEGIN :SNAP := STATSPACK.SNAP; END;
-------------------------------------------------------------
Instance Activity Stats DB/Inst: XE/XE Snaps: 13-14
Statistic Total per Second per Trans
--------------------------------- ------------------ -------------- ------------
Batched IO (bound) vector count 0 0.0 0.0
Batched IO (full) vector count 0 0.0 0.0
Batched IO block miss count 0 0.0 0.0
Batched IO buffer defrag count 0 0.0 0.0
Batched IO double miss count 0 0.0 0.0
Batched IO same unit count 0 0.0 0.0
Batched IO vector block count 0 0.0 0.0
Batched IO vector read count 0 0.0 0.0
Block Cleanout Optim referenced 14 0.1 0.1
CCursor + sql area evicted 0 0.0 0.0
CPU used by this session 1,844 6.1 12.0
CPU used when call started 2,088 6.9 13.6
CR blocks created 0 0.0 0.0
Cached Commit SCN referenced 3,861,311 12,701.7 25,073.5
Commit SCN cached 0 0.0 0.0
DB time 300,602 988.8 1,952.0
DBWR checkpoint buffers written 0 0.0 0.0
DBWR checkpoints 0 0.0 0.0
DBWR tablespace checkpoint buffer 0 0.0 0.0
DBWR thread checkpoint buffers wr 0 0.0 0.0
DBWR transaction table writes 0 0.0 0.0
DBWR undo block writes 582 1.9 3.8
Effective IO time 1,030,603,929 3,390,144.5 6,692,233.3
HSC Heap Segment Block Changes 9,775 32.2 63.5
Heap Segment Array Inserts 134 0.4 0.9
Heap Segment Array Updates 0 0.0 0.0
IMU Flushes 143 0.5 0.9
IMU Redo allocation size 1,487,020 4,891.5 9,656.0
IMU commits 11 0.0 0.1
IMU contention 142 0.5 0.9
IMU ktichg flush 0 0.0 0.0
IMU recursive-transaction flush 1 0.0 0.0
IMU undo allocation size 2,068,656 6,804.8 13,432.8
Number of read IOs issued 62,141 204.4 403.5
RowCR - row contention 0 0.0 0.0
RowCR attempts 1 0.0 0.0
RowCR hits 1 0.0 0.0
SQL*Net roundtrips to/from client 33 0.1 0.2
active txn count during cleanout 109 0.4 0.7
application wait time 0 0.0 0.0
background checkpoints completed 0 0.0 0.0
background checkpoints started 0 0.0 0.0
background timeouts 1,206 4.0 7.8
buffer is not pinned count 125,027 411.3 811.9
buffer is pinned count 119,205 392.1 774.1
bytes received via SQL*Net from c 7,694 25.3 50.0
bytes sent via SQL*Net to client 9,280 30.5 60.3
calls to get snapshot scn: kcmgss 4,290 14.1 27.9
calls to kcmgas 209 0.7 1.4
calls to kcmgcs 5,909 19.4 38.4
cell physical IO interconnect byt 32,569,245,184 107,135,675.0 ############
change write time 9 0.0 0.1
cleanout - number of ktugct calls 112 0.4 0.7
cleanouts only - consistent read 1 0.0 0.0
cluster key scan block gets 0 0.0 0.0
cluster key scans 0 0.0 0.0
Instance Activity Stats DB/Inst: XE/XE Snaps: 13-14
Statistic Total per Second per Trans
--------------------------------- ------------------ -------------- ------------
commit cleanout failures: block l 0 0.0 0.0
commit cleanout failures: callbac 9 0.0 0.1
commit cleanouts 9,909 32.6 64.3
commit cleanouts successfully com 9,900 32.6 64.3
commit txn count during cleanout 48 0.2 0.3
concurrency wait time 0 0.0 0.0
consistent changes 0 0.0 0.0
consistent gets 3,989,523 13,123.4 25,906.0
consistent gets - examination 2,367 7.8 15.4
consistent gets direct 3,857,814 12,690.2 25,050.7
consistent gets from cache 131,709 433.3 855.3
consistent gets from cache (fastp 45,515 149.7 295.6
cursor authentications 0 0.0 0.0
data blocks consistent reads - un 0 0.0 0.0
db block changes 22,496 74.0 146.1
db block gets 13,616 44.8 88.4
db block gets from cache 13,616 44.8 88.4
db block gets from cache (fastpat 928 3.1 6.0
deferred (CURRENT) block cleanout 9,334 30.7 60.6
dirty buffers inspected 8,129 26.7 52.8
enqueue conversions 0 0.0 0.0
enqueue releases 567 1.9 3.7
enqueue requests 557 1.8 3.6
enqueue timeouts 0 0.0 0.0
enqueue waits 0 0.0 0.0
execute count 4,091 13.5 26.6
file io wait time 1,916,918,899 6,305,654.3 ############
free buffer inspected 112,825 371.1 732.6
free buffer requested 107,530 353.7 698.3
heap block compress 0 0.0 0.0
hot buffers moved to head of LRU 12,620 41.5 82.0
immediate (CR) block cleanout app 1 0.0 0.0
immediate (CURRENT) block cleanou 122 0.4 0.8
index crx upgrade (positioned) 0 0.0 0.0
index fast full scans (full) 1 0.0 0.0
index fetch by key 159 0.5 1.0
index scans kdiixs1 2,098 6.9 13.6
leaf node 90-10 splits 1 0.0 0.0
leaf node splits 47 0.2 0.3
lob reads 0 0.0 0.0
lob writes 0 0.0 0.0
lob writes unaligned 0 0.0 0.0
logons cumulative 1 0.0 0.0
max cf enq hold time 0 0.0 0.0
messages received 946 3.1 6.1
messages sent 946 3.1 6.1
min active SCN optimization appli 21 0.1 0.1
no work - consistent read gets 3,979,853 13,091.6 25,843.2
non-idle wait count 167,913 552.4 1,090.3
non-idle wait time 268,075 881.8 1,740.8
opened cursors cumulative 4,203 13.8 27.3
parse count (failures) 0 0.0 0.0
parse count (hard) 0 0.0 0.0
parse count (total) 98 0.3 0.6
parse time cpu 0 0.0 0.0
parse time elapsed 1 0.0 0.0
Instance Activity Stats DB/Inst: XE/XE Snaps: 13-14
Statistic Total per Second per Trans
--------------------------------- ------------------ -------------- ------------
physical read IO requests 168,897 555.6 1,096.7
physical read bytes 32,473,743,360 106,821,524.2 ############
physical read total IO requests 169,417 557.3 1,100.1
physical read total bytes 32,486,031,360 106,861,945.3 ############
physical read total multi block r 62,163 204.5 403.7
physical reads 3,964,080 13,039.7 25,740.8
physical reads cache 106,742 351.1 693.1
physical reads cache prefetch 14,721 48.4 95.6
physical reads direct 3,857,338 12,688.6 25,047.7
physical reads direct temporary t 0 0.0 0.0
physical reads prefetch warmup 0 0.0 0.0
physical write IO requests 7,821 25.7 50.8
physical write bytes 71,491,584 235,169.7 464,231.1
physical write total IO requests 8,110 26.7 52.7
physical write total bytes 83,213,824 273,729.7 540,349.5
physical write total multi block 25 0.1 0.2
physical writes 8,727 28.7 56.7
physical writes direct 0 0.0 0.0
physical writes from cache 8,727 28.7 56.7
physical writes non checkpoint 8,664 28.5 56.3
pinned buffers inspected 1 0.0 0.0
prefetch warmup blocks aged out b 0 0.0 0.0
prefetched blocks aged out before 0 0.0 0.0
process last non-idle time 304 1.0 2.0
recursive calls 5,842 19.2 37.9
recursive cpu usage 1,821 6.0 11.8
redo blocks checksummed by FG (ex 11,095 36.5 72.1
redo blocks written 19,727 64.9 128.1
redo entries 9,748 32.1 63.3
redo size 9,901,596 32,571.0 64,296.1
redo synch long waits 2 0.0 0.0
redo synch time 3 0.0 0.0
redo synch time (usec) 35,960 118.3 233.5
redo synch writes 11 0.0 0.1
redo wastage 43,772 144.0 284.2
redo write time 357 1.2 2.3
redo writes 188 0.6 1.2
rollback changes - undo records a 0 0.0 0.0
rollbacks only - consistent read 0 0.0 0.0
rows fetched via callback 12 0.0 0.1
scheduler wait time 1,163 3.8 7.6
session connect time 334 1.1 2.2
session cursor cache hits 4,118 13.6 26.7
session logical reads 4,003,140 13,168.2 25,994.4
session uga memory max 12,482,920 41,062.2 81,057.9
shared hash latch upgrades - no w 17 0.1 0.1
sorts (memory) 82 0.3 0.5
sorts (rows) 5,576 18.3 36.2
sql area evicted 0 0.0 0.0
sql area purged 0 0.0 0.0
summed dirty queue length 54,161 178.2 351.7
switch current to new buffer 1 0.0 0.0
table fetch by rowid 121,024 398.1 785.9
table fetch continued row 0 0.0 0.0
table scan blocks gotten 3,856,291 12,685.2 25,040.9
table scan rows gotten 3,856,423 12,685.6 25,041.7
Instance Activity Stats DB/Inst: XE/XE Snaps: 13-14
Statistic Total per Second per Trans
--------------------------------- ------------------ -------------- ------------
table scans (cache partitions) 0 0.0 0.0
table scans (direct read) 1,882 6.2 12.2
table scans (long tables) 1,882 6.2 12.2
table scans (short tables) 20 0.1 0.1
total cf enq hold time 0 0.0 0.0
total number of cf enq holders 0 0.0 0.0
total number of times SMON posted 0 0.0 0.0
undo change vector size 4,105,512 13,505.0 26,659.2
user I/O wait time 265,366 872.9 1,723.2
user calls 50 0.2 0.3
user commits 154 0.5 1.0
workarea executions - optimal 86 0.3 0.6
write clones created in foregroun 2 0.0 0.0
-------------------------------------------------------------
Instance Activity Stats DB/Inst: XE/XE Snaps: 13-14
-> Statistics with absolute values (should not be diffed)
Statistic Begin Value End Value
--------------------------------- --------------- ---------------
logons current 34 24
opened cursors current 61 31
session cursor cache count 1,770 1,820
-------------------------------------------------------------
Instance Activity Stats DB/Inst: XE/XE Snaps: 13-14
-> Statistics identified by '(derived)' come from sources other than SYSSTAT
Statistic Total per Hour
--------------------------------- ------------------ ---------
log switches (derived) 0 .00
-------------------------------------------------------------
OS Statistics DB/Inst: XE/XE Snaps: 13-14
-> ordered by statistic type (CPU use, Virtual Memory, Hardware Config), Name
Statistic Total
------------------------- ----------------------
BUSY_TIME 4,851
IDLE_TIME 112,172
IOWAIT_TIME 80,601
SYS_TIME 3,848
USER_TIME 676
RSRC_MGR_CPU_WAIT_TIME 982
VM_IN_BYTES 32,327,352,320
VM_OUT_BYTES 82,188,288
PHYSICAL_MEMORY_BYTES 8,191,578,112
NUM_CPUS 4
NUM_CPU_CORES 2
NUM_CPU_SOCKETS 1
GLOBAL_RECEIVE_SIZE_MAX 212,992
GLOBAL_SEND_SIZE_MAX 212,992
TCP_RECEIVE_SIZE_DEFAULT 87,380
TCP_RECEIVE_SIZE_MAX 6,291,456
TCP_RECEIVE_SIZE_MIN 4,096
TCP_SEND_SIZE_DEFAULT 16,384
TCP_SEND_SIZE_MAX 4,194,304
TCP_SEND_SIZE_MIN 4,096
-------------------------------------------------------------
OS Statistics - detail DB/Inst: XE/XE Snaps: 13-14
Snap Snapshot
Id Day Time Load %Busy %User %System %WIO %WCPU
------ --------------- ------ ------ ------ ------- ------ ------
13 Fri 12 19:08:41 3.1
14 Fri 12 19:13:45 3.5 4.1 .6 3.3 68.9
-------------------------------------------------------------
IO Stat by Function - summary DB/Inst: XE/XE Snaps: 13-14
->Data Volume values suffixed with M,G,T,P are in multiples of 1024,
other values suffixed with K,M,G,T,P are in multiples of 1000
->ordered by Data Volume (Read+Write) desc
---------- Read --------- --------- Write -------- --- Wait ----
Data Requests Data Data Requests Data Avg
Function Volume /sec Vol/sec Volume /sec Vol/sec Count Tm(ms)
--------------- ------ -------- -------- ------ -------- -------- ------ ------
Direct Reads 30G 205.6 99.7M 0.0
Buffer Cache Re 839M 353.0 2.8M 92K 0.0
Others 8M 1.7 .0M 2M .3 .0M 611 0.0
-------------------------------------------------------------
IO Stat by Function - detail DB/Inst: XE/XE Snaps: 13-14
->ordered by Data Volume (Read+Write) desc
----------- Read ---------- ----------- Write ---------
Small Large Small Large Small Large Small Large
Read Read Data Data Write Write Data Data
Function Reqs Reqs Read Read Reqs Reqs Writn Writn
------------------ ------ ------ ------ ------ ------ ------ ------ ------
Direct Reads 63K 30G
Buffer Cache Reads 107K 839M
Others 512 8M 99 2M
-------------------------------------------------------------
Tablespace IO Stats DB/Inst: XE/XE Snaps: 13-14
->ordered by IOs (Reads + Writes) desc
Tablespace
------------------------------
Av Av Av Av Buffer Av Buf
Reads Reads/s Rd(ms) Blks/Rd Writes Writes/s Waits Wt(ms)
-------------- ------- ------ ------- ------------ -------- ---------- ------
USERS
169,586 558 9.5 23.5 8,091 27 0 0.0
STATSPACK
131 0 11.1 1.0 106 0 0 0.0
UNDOTBS1
15 0 19.3 1.0 68 0 0 0.0
-------------------------------------------------------------
File IO Stats DB/Inst: XE/XE Snaps: 13-14
->Mx Rd Bkt: Max bucket time for single block read
->ordered by Tablespace, File
Tablespace Filename
------------------------ ----------------------------------------------------
Av Mx Av
Av Rd Rd Av Av Buffer BufWt
Reads Reads/s (ms) Bkt Blks/Rd Writes Writes/s Waits (ms)
-------------- ------- ----- --- ------- ------------ -------- ---------- ------
STATSPACK /mnt/myrbd/XE/statspack.dbf
131 0 11.1 64 1.0 106 0 0
UNDOTBS1 /mnt/myrbd/XE/undotbs1.dbf
15 0 19.3 64 1.0 68 0 0
USERS /mnt/myrbd/XE/users.dbf
169,586 558 9.5 ### 23.5 8,091 27 0
-------------------------------------------------------------
File Read Histogram Stats DB/Inst: XE/XE Snaps: 13-14
->Number of single block reads in each time range
->Tempfiles are not included
->ordered by Tablespace, File
Tablespace Filename
------------------------ ----------------------------------------------------
0 - 2 ms 2 - 4 ms 4 - 8 ms 8 - 16 ms 16 - 32 ms 32+ ms
------------ ------------ ------------ ------------ ------------ ------------
UNDOTBS1 /mnt/myrbd/XE/undotbs1.dbf
4 1 0 1 6 3
STATSPACK /mnt/myrbd/XE/statspack.dbf
66 4 5 17 25 14
USERS /mnt/myrbd/XE/users.dbf
45,130 2,737 2,647 13,602 25,254 17,671
-------------------------------------------------------------
Instance Recovery Stats DB/Inst: XE/XE Snaps: 13-14
-> B: Begin snapshot, E: End snapshot
Targt Estd Log File Log Ckpt Log Ckpt
MTTR MTTR Recovery Actual Target Size Timeout Interval
(s) (s) Estd IOs Redo Blks Redo Blks Redo Blks Redo Blks Redo Blks
- ----- ----- ---------- --------- --------- ---------- --------- ------------
B 0 0 1713 5924 82944 82944
E 0 0 3512 24343 9877 82944 9877
-------------------------------------------------------------
Memory Target Advice DB/Inst: XE/XE Snaps: 13-14
-> Advice Reset: if this is null, the data shown has been diffed between
the Begin and End snapshots. If this is 'Y', the advisor has been
reset during this interval due to memory resize operations, and
the data shown is since the reset operation.
Memory Size Est. Advice
Memory Size (M) Factor DB time (s) Reset
--------------- ----------- ------------ ------
512 .5 2,698
768 .8 2,698
1,024 1.0 2,698
1,280 1.3 2,698
1,536 1.5 2,698
1,792 1.8 2,698
2,048 2.0 2,698
-------------------------------------------------------------
Memory Dynamic Components DB/Inst: XE/XE Snaps: 13-14
-> Op - memory resize Operation
-> Cache: D: Default, K: Keep, R: Recycle
-> Mode: DEF: DEFerred mode, IMM: IMMediate mode
Begin Snap End Snap Op Last Op
Cache Size (M) Size (M) Count Type/Mode Last Op Time
---------------------- ---------- -------- ------- ---------- ---------------
D:buffer cache 424 0 INITIA/
PGA Target 412 0 STATIC
SGA Target 612 0 STATIC
java pool 4 0 STATIC
large pool 4 0 STATIC
shared pool 168 0 STATIC
-------------------------------------------------------------
Buffer Pool Statistics DB/Inst: XE/XE Snaps: 13-14
-> Standard block size Pools D: default, K: keep, R: recycle
-> Default Pools for other block sizes: 2k, 4k, 8k, 16k, 32k
-> Buffers: the number of buffers. Units of K, M, G are divided by 1000
Free Writ Buffer
Pool Buffer Physical Physical Buffer Comp Busy
P Buffers Hit% Gets Reads Writes Waits Wait Waits
--- ------- ---- -------------- ------------ ----------- ------- ---- ----------
D 52K 27 145,694 107,012 8,951 0 0 0
-------------------------------------------------------------
PGA Aggr Target Stats DB/Inst: XE/XE Snaps: 13-14
-> B: Begin snap E: End snap (rows identified with B or E contain data
which is absolute i.e. not diffed over the interval)
-> PGA cache hit % - percentage of W/A (WorkArea) data processed only in-memory
-> Auto PGA Target - actual workarea memory target
-> W/A PGA Used - amount of memory used for all WorkAreas (manual + auto)
-> %PGA W/A Mem - percentage of PGA memory allocated to WorkAreas
-> %Auto W/A Mem - percentage of WorkArea memory controlled by Auto Mem Mgmt
-> %Man W/A Mem - percentage of WorkArea memory under Manual control
PGA Cache Hit % W/A MB Processed Extra W/A MB Read/Written
--------------- ---------------- -------------------------
100.0 22 0
PGA Aggr Target Histogram DB/Inst: XE/XE Snaps: 13-14
-> Optimal Executions are purely in-memory operations
Low High
Optimal Optimal Total Execs Optimal Execs 1-Pass Execs M-Pass Execs
------- ------- -------------- ------------- ------------ ------------
2K 4K 59 59 0 0
64K 128K 2 2 0 0
128K 256K 1 1 0 0
256K 512K 2 2 0 0
512K 1024K 14 14 0 0
4M 8M 2 2 0 0
-------------------------------------------------------------
PGA Memory Advisory DB/Inst: XE/XE End Snap: 14
-> When using Auto Memory Mgmt, minimally choose a pga_aggregate_target value
where Estd PGA Overalloc Count is 0
Estd Extra Estd
PGA Aggr W/A MB Estd Time PGA Estd PGA
Target Size W/A MB Read/Written to Process Cache Overalloc
Est (MB) Factr Processed to Disk Bytes (s) Hit % Count
---------- ------ -------------- -------------- ---------- ------ ----------
52 0.1 306 0 0.1 100.0 2
103 0.3 306 0 0.1 100.0 0
206 0.5 306 0 0.1 100.0 0
309 0.8 306 0 0.1 100.0 0
412 1.0 306 0 0.1 100.0 0
494 1.2 306 0 0.1 100.0 0
577 1.4 306 0 0.1 100.0 0
659 1.6 306 0 0.1 100.0 0
742 1.8 306 0 0.1 100.0 0
824 2.0 306 0 0.1 100.0 0
1,236 3.0 306 0 0.1 100.0 0
1,648 4.0 306 0 0.1 100.0 0
2,472 6.0 306 0 0.1 100.0 0
3,296 8.0 306 0 0.1 100.0 0
-------------------------------------------------------------
Process Memory Summary Stats DB/Inst: XE/XE Snaps: 13-14
-> B: Begin snap E: End snap
-> All rows below contain absolute values (i.e. not diffed over the interval)
-> Max Alloc is Maximum PGA Allocation size at snapshot time
Hist Max Alloc is the Historical Max Allocation for still-connected processes
-> Num Procs or Allocs: For Begin/End snapshot lines, it is the number of
processes. For Category lines, it is the number of allocations
-> ordered by Begin/End snapshot, Alloc (MB) desc
Hist Num
Avg Std Dev Max Max Procs
Alloc Used Freeabl Alloc Alloc Alloc Alloc or
Category (MB) (MB) (MB) (MB) (MB) (MB) (MB) Allocs
- -------- --------- --------- -------- -------- ------- ------- ------ ------
B -------- 109.2 64.1 18.5 2.8 2.6 12 12 39
Other 84.0 2.2 2.2 12 12 39
Freeable 18.5 .0 2.1 1.9 6 9
SQL 5.0 4.5 .2 .4 1 6 18
PL/SQL 1.7 1.6 .0 .1 0 0 34
E -------- 60.7 40.7 13.9 2.1 2.7 12 12 29
Other 46.0 1.6 2.2 12 12 29
Freeable 13.9 .0 2.0 2.3 6 7
PL/SQL .5 .5 .0 .1 0 0 24
SQL .3 .1 .0 .0 0 6 8
-------------------------------------------------------------
Top Process Memory (by component) DB/Inst: XE/XE Snaps: 13-14
-> ordered by Begin/End snapshot, Alloc (MB) desc
Alloc Used Freeabl Max Hist Max
PId Category (MB) (MB) (MB) Alloc (MB) Alloc (MB)
- ------ ------------- ------- ------- -------- ---------- ----------
B 11 LGWR -------- 11.7 10.8 .2 11.7 11.7
Other 11.5 11.5 11.5
Freeable .2 .0 .2
PL/SQL .0 .0 .0 .0
40 ------------ 8.1 1.5 6.2 8.1 8.1
Freeable 6.2 .0 6.2
Other 1.6 1.6 1.6
PL/SQL .2 .2 .2 .2
SQL .1 .1 .1 6.2
10 DBW0 -------- 7.3 6.8 .3 7.3 7.3
Other 7.0 7.0 7.0
Freeable .3 .0 .3
PL/SQL .0 .0 .0 .0
28 ------------ 5.3 2.7 .0 5.3 5.3
Other 5.1 5.1 5.1
PL/SQL .1 .1 .1 .1
SQL .0 .0 .0 1.8
32 ------------ 5.3 2.7 .0 5.3 5.3
Other 5.1 5.1 5.1
PL/SQL .1 .1 .1 .1
SQL .0 .0 .0 1.8
13 SMON -------- 4.8 1.0 3.6 4.8 4.8
Freeable 3.6 .0 3.6
Other 1.2 1.2 1.2
PL/SQL .0 .0 .0 .0
SQL .0 .0 .0 2.1
29 ------------ 4.8 2.1 2.4 4.8 4.8
Freeable 2.4 .0 2.4
Other 2.2 2.2 2.2
PL/SQL .1 .1 .1 .1
SQL .0 .0 .0 1.8
33 ------------ 4.8 2.3 .0 4.8 4.8
Other 4.6 4.6 4.6
PL/SQL .1 .1 .1 .1
SQL .0 .0 .0 1.8
34 ------------ 4.8 2.3 .0 4.8 4.8
Other 3.5 3.5 3.5
SQL 1.1 1.1 1.1 1.8
PL/SQL .1 .1 .1 .1
35 ------------ 4.8 2.3 .0 4.8 4.8
Other 4.6 4.6 4.6
PL/SQL .1 .1 .1 .1
SQL .0 .0 .0 1.8
36 ------------ 4.8 2.1 2.4 4.8 4.8
Freeable 2.4 .0 2.4
Other 2.2 2.2 2.2
PL/SQL .1 .1 .1 .1
SQL .0 .0 .0 1.8
39 ------------ 4.8 2.3 .0 4.8 4.8
Other 3.5 3.5 3.5
SQL 1.1 1.1 1.1 1.8
PL/SQL .1 .1 .1 .1
30 ------------ 4.7 2.3 .0 4.7 4.7
Top Process Memory (by component) DB/Inst: XE/XE Snaps: 13-14
-> ordered by Begin/End snapshot, Alloc (MB) desc
Alloc Used Freeabl Max Hist Max
PId Category (MB) (MB) (MB) Alloc (MB) Alloc (MB)
- ------ ------------- ------- ------- -------- ---------- ----------
B 30 Other 3.5 3.5 3.5
SQL 1.1 1.1 1.1 1.7
PL/SQL .1 .1 .1 .1
31 ------------ 4.7 2.3 .0 4.7 4.7
Other 3.5 3.5 3.5
SQL 1.1 1.1 1.1 1.7
PL/SQL .1 .1 .1 .1
15 MMON -------- 4.5 1.9 2.3 4.5 4.5
Freeable 2.3 .0 2.3
Other 2.1 2.1 2.1
PL/SQL .1 .1 .1 .1
SQL .0 .0 .0 1.1
22 TNS V1-V3 --- 2.9 1.6 .9 2.9 6.8
Other 1.8 1.8 3.4
Freeable .9 .0 .9
SQL .1 .0 .1 2.5
PL/SQL .0 .0 .0 .0
25 Q000 -------- 1.6 1.1 .3 1.6 1.6
Other 1.0 1.0 1.0
Freeable .3 .0 .3
PL/SQL .2 .2 .2 .2
SQL .0 .0 .0 .2
12 CKPT -------- 1.5 .8 .0 1.5 1.5
Other 1.5 1.5 1.5
PL/SQL .0 .0 .0 .0
17 D000 -------- 1.3 1.2 .0 1.3 1.3
Other 1.3 1.3 1.3
8 DIA0 -------- 1.2 1.0 .0 1.2 1.2
Other 1.2 1.2 1.2
PL/SQL .0 .0 .0 .0
E 11 LGWR -------- 11.7 10.8 .2 11.7 11.7
Other 11.5 11.5 11.5
Freeable .2 .0 .2
PL/SQL .0 .0 .0 .0
28 ------------ 8.1 1.5 6.3 8.1 8.1
Freeable 6.3 .0 6.3
Other 1.6 1.6 1.6
PL/SQL .2 .2 .2 .2
SQL .1 .1 .1 6.2
10 DBW0 -------- 7.3 6.8 .3 7.3 7.3
Other 7.0 7.0 7.0
Freeable .3 .0 .3
PL/SQL .0 .0 .0 .0
13 SMON -------- 4.8 1.0 3.6 4.8 4.8
Freeable 3.6 .0 3.6
Other 1.1 1.1 1.1
PL/SQL .0 .0 .0 .0
SQL .0 .0 .0 2.1
15 MMON -------- 4.5 1.9 2.3 4.5 4.5
Freeable 2.3 .0 2.3
Other 2.1 2.1 2.1
PL/SQL .1 .1 .1 .1
SQL .0 .0 .0 1.1
Top Process Memory (by component) DB/Inst: XE/XE Snaps: 13-14
-> ordered by Begin/End snapshot, Alloc (MB) desc
Alloc Used Freeabl Max Hist Max
PId Category (MB) (MB) (MB) Alloc (MB) Alloc (MB)
- ------ ------------- ------- ------- -------- ---------- ----------
E 22 TNS V1-V3 --- 2.9 1.6 .9 2.9 6.8
Other 1.8 1.8 3.4
Freeable .9 .0 .9
SQL .1 .0 .1 2.5
PL/SQL .0 .0 .0 .0
25 Q000 -------- 1.6 1.1 .3 1.6 1.6
Other 1.0 1.0 1.0
Freeable .3 .0 .3
PL/SQL .2 .2 .2 .2
SQL .0 .0 .0 .2
12 CKPT -------- 1.5 .8 .0 1.5 1.5
Other 1.5 1.5 1.5
PL/SQL .0 .0 .0 .0
17 D000 -------- 1.3 1.2 .0 1.3 1.3
Other 1.3 1.3 1.3
8 DIA0 -------- 1.2 1.0 .0 1.2 1.2
Other 1.2 1.2 1.2
PL/SQL .0 .0 .0 .0
14 RECO -------- 1.1 .8 .0 1.1 1.1
Other 1.1 1.1 1.1
PL/SQL .0 .0 .0 .0
SQL .0 .0 .0 .1
27 W001 -------- 1.1 .8 .0 1.1 1.1
Other 1.1 1.1 1.1
SQL .0 .0 .0 .0
PL/SQL .0 .0 .0 .0
7 DBRM -------- 1.0 .8 .0 1.0 1.0
Other 1.0 1.0 1.0
PL/SQL .0 .0 .0 .0
SQL .0 .0 .0 .1
-------------------------------------------------------------
Latch Activity DB/Inst: XE/XE Snaps: 13-14
->"Get Requests", "Pct Get Miss" and "Avg Slps/Miss" are statistics for
willing-to-wait latch get requests
->"NoWait Requests", "Pct NoWait Miss" are for no-wait latch get requests
->"Pct Misses" for both should be very close to 0.0
Pct Avg Wait Pct
Get Get Slps Time NoWait NoWait
Latch Requests Miss /Miss (s) Requests Miss
------------------------ -------------- ------ ------ ------ ------------ ------
AQ deq hash table latch 1 0.0 0 0
ASM db client latch 198 0.0 0 0
ASM map operation hash t 1 0.0 0 0
ASM network state latch 5 0.0 0 0
Change Notification Hash 101 0.0 0 0
Consistent RBA 188 0.0 0 0
DML lock allocation 446 0.0 0 0
Event Group Locks 2 0.0 0 0
FOB s.o list latch 38 0.0 0 0
File State Object Pool P 1 0.0 0 0
I/O Staticstics latch 1 0.0 0 0
IPC stats buffer allocat 1 0.0 0 0
In memory undo latch 36,893 0.0 1.0 0 154 0.0
JS Sh mem access 1 0.0 0 0
JS queue access latch 1 0.0 0 0
JS slv state obj latch 1 0.0 0 0
KFC FX Hash Latch 1 0.0 0 0
KFC Hash Latch 1 0.0 0 0
KFCL LE Freelist 1 0.0 0 0
KGNFS-NFS:SHM structure 1 0.0 0 0
KGNFS-NFS:SVR LIST 1 0.0 0 0
KJC message pool free li 1 0.0 0 0
KJCT flow control latch 1 0.0 0 0
KMG MMAN ready and start 100 0.0 0 0
KTF sga latch 1 0.0 0 87 0.0
KWQP Prop Status 1 0.0 0 0
Locator state objects po 1 0.0 0 0
Lsod array latch 1 0.0 0 0
MQL Tracking Latch 0 0 6 0.0
Memory Management Latch 1 0.0 0 100 0.0
Memory Queue 1 0.0 0 0
Memory Queue Message Sub 1 0.0 0 0
Memory Queue Message Sub 1 0.0 0 0
Memory Queue Message Sub 1 0.0 0 0
Memory Queue Message Sub 1 0.0 0 0
Memory Queue Subscriber 1 0.0 0 0
MinActiveScn Latch 2 0.0 0 0
Mutex 1 0.0 0 0
Mutex Stats 1 0.0 0 0
OS process 34 0.0 0 0
OS process allocation 614 0.0 0 0
OS process: request allo 12 0.0 0 0
PL/SQL warning settings 14 0.0 0 0
PX hash array latch 1 0.0 0 0
QMT 1 0.0 0 0
SGA IO buffer pool latch 6 0.0 0 6 0.0
SGA blob parent 1 0.0 0 0
SGA bucket locks 1 0.0 0 0
SGA heap locks 1 0.0 0 0
SGA pool locks 1 0.0 0 0
Latch Activity DB/Inst: XE/XE Snaps: 13-14
->"Get Requests", "Pct Get Miss" and "Avg Slps/Miss" are statistics for
willing-to-wait latch get requests
->"NoWait Requests", "Pct NoWait Miss" are for no-wait latch get requests
->"Pct Misses" for both should be very close to 0.0
Pct Avg Wait Pct
Get Get Slps Time NoWait NoWait
Latch Requests Miss /Miss (s) Requests Miss
------------------------ -------------- ------ ------ ------ ------------ ------
SQL memory manager latch 12 0.0 0 99 0.0
SQL memory manager worka 6,765 0.0 0 0
Shared B-Tree 15 0.0 0 0
Streams Generic 1 0.0 0 0
Testing 1 0.0 0 0
Token Manager 1 0.0 0 0
WCR: sync 1 0.0 0 0
Write State Object Pool 1 0.0 0 0
XDB NFS Security Latch 1 0.0 0 0
XDB unused session pool 1 0.0 0 0
XDB used session pool 1 0.0 0 0
active checkpoint queue 888 0.0 0 0
active service list 140 0.0 0 250 0.0
buffer pool 1 0.0 0 0
business card 1 0.0 0 0
cache buffer handles 358 0.0 0 0
cache buffers chains 477,546 0.0 0 132,590 0.0
cache buffers lru chain 10,477 0.0 0.0 0 125,954 0.2
call allocation 25 0.0 0 0
cas latch 1 0.0 0 0
change notification clie 1 0.0 0 0
channel handle pool latc 13 0.0 0 0
channel operations paren 1,614 0.0 0 0
checkpoint queue latch 22,169 0.0 0.0 0 10,320 0.0
client/application info 12 0.0 0 0
compile environment latc 1 0.0 0 0
cp cmon/server latch 1 0.0 0 0
cp pool latch 1 0.0 0 0
cp server hash latch 1 0.0 0 0
cp sga latch 5 0.0 0 0
cvmap freelist lock 1 0.0 0 0
deferred cleanup latch 5 0.0 0 0
dml lock allocation 5 0.0 0 0
done queue latch 1 0.0 0 0
dummy allocation 13 0.0 0 0
enqueue hash chains 1,117 0.0 0 0
enqueues 282 0.0 0 0
fifth spare latch 1 0.0 0 0
flashback copy 1 0.0 0 0
fourth Audit Vault latch 1 0.0 0 0
gc element 1 0.0 0 0
gcs commit scn state 1 0.0 0 0
gcs partitioned table ha 1 0.0 0 0
gcs pcm hashed value buc 1 0.0 0 0
gcs resource freelist 1 0.0 0 0
gcs resource hash 1 0.0 0 0
gcs resource scan list 1 0.0 0 0
gcs shadows freelist 1 0.0 0 0
ges domain table 1 0.0 0 0
ges enqueue table freeli 1 0.0 0 0
Latch Activity DB/Inst: XE/XE Snaps: 13-14
->"Get Requests", "Pct Get Miss" and "Avg Slps/Miss" are statistics for
willing-to-wait latch get requests
->"NoWait Requests", "Pct NoWait Miss" are for no-wait latch get requests
->"Pct Misses" for both should be very close to 0.0
Pct Avg Wait Pct
Get Get Slps Time NoWait NoWait
Latch Requests Miss /Miss (s) Requests Miss
------------------------ -------------- ------ ------ ------ ------------ ------
ges group table 1 0.0 0 0
ges process hash list 1 0.0 0 0
ges process parent latch 1 0.0 0 0
ges resource hash list 1 0.0 0 0
ges resource scan list 1 0.0 0 0
ges resource table freel 1 0.0 0 0
ges value block free lis 1 0.0 0 0
global KZLD latch for me 1 0.0 0 0
global tx hash mapping 1 0.0 0 0
granule operation 1 0.0 0 0
heartbeat check 1 0.0 0 0
intra txn parallel recov 1 0.0 0 0
io pool granule metadata 1 0.0 0 0
job workq parent latch 1 0.0 0 0
k2q lock allocation 1 0.0 0 0
kdlx hb parent latch 1 0.0 0 0
kgb parent 1 0.0 0 0
kgnfs mount latch 1 0.0 0 0
ksfv messages 1 0.0 0 0
ksim group membership ca 1 0.0 0 0
kss move lock 1 0.0 0 0
ksuosstats global area 23 0.0 0 0
ksv allocation latch 5 0.0 0 0
ksv class latch 1 0.0 0 0
ksv msg queue latch 1 0.0 0 0
ksz_so allocation latch 12 0.0 0 0
ktm global data 3 0.0 0 0
kwqbsn:qsga 14 0.0 0 0
lgwr LWN SCN 207 0.0 0 0
list of block allocation 650 0.0 0 0
loader state object free 3,766 0.0 0 0
lob segment dispenser la 1 0.0 0 0
lob segment hash table l 1 0.0 0 0
lob segment query latch 1 0.0 0 0
lock DBA buffer during m 1 0.0 0 0
logical standby cache 1 0.0 0 0
logminer context allocat 1 0.0 0 0
logminer work area 1 0.0 0 0
longop free list parent 1 0.0 0 0
mapped buffers lru chain 1 0.0 0 0
message pool operations 1 0.0 0 0
messages 4,494 0.0 0 0
mostly latch-free SCN 211 0.0 0 0
msg queue latch 1 0.0 0 0
multiblock read objects 1,648 0.0 0 0
name-service namespace b 1 0.0 0 0
ncodef allocation latch 5 0.0 0 0
object queue header heap 3,562 0.0 0 476 0.0
object queue header oper 261,485 0.0 0.0 0 0
object stats modificatio 11 0.0 0 0
Latch Activity DB/Inst: XE/XE Snaps: 13-14
->"Get Requests", "Pct Get Miss" and "Avg Slps/Miss" are statistics for
willing-to-wait latch get requests
->"NoWait Requests", "Pct NoWait Miss" are for no-wait latch get requests
->"Pct Misses" for both should be very close to 0.0
Pct Avg Wait Pct
Get Get Slps Time NoWait NoWait
Latch Requests Miss /Miss (s) Requests Miss
------------------------ -------------- ------ ------ ------ ------------ ------
parallel query alloc buf 41 0.0 0 0
parallel query stats 1 0.0 0 0
parameter list 15 0.0 0 0
parameter table manageme 12 0.0 0 0
peshm 1 0.0 0 0
pesom_free_list 1 0.0 0 0
pesom_hash_node 1 0.0 0 0
post/wait queue 6 0.0 0 2 0.0
process allocation 12 0.0 0 1 0.0
process group creation 12 0.0 0 0
process queue 1 0.0 0 0
process queue reference 1 0.0 0 0
qmn task queue latch 44 0.0 0 0
query server freelists 1 0.0 0 0
queued dump request 1 0.0 0 0
queuing load statistics 1 0.0 0 0
recovery domain hash lis 1 0.0 0 0
redo allocation 10,461 0.1 0.0 0 0
redo copy 1 0.0 0 9,757 0.1
redo writing 1,651 0.0 0 0
resmgr group change latc 3 0.0 0 0
resmgr:active threads 13 0.0 0 111 0.0
resmgr:actses change gro 2 0.0 0 0
resmgr:actses change sta 1 0.0 0 0
resmgr:free threads list 12 0.0 0 0
resmgr:plan CPU method 1 0.0 0 0
resmgr:resource group CP 12,068 0.2 0.0 0 0
resmgr:schema config 1 0.0 0 5 0.0
resmgr:session queuing 1 0.0 0 0
rm cas latch 1 0.0 0 0
row cache objects 1,411 0.0 0 0
rules engine rule set st 100 0.0 0 0
second Audit Vault latch 1 0.0 0 0
second spare latch 1 0.0 0 0
sequence cache 6 0.0 0 0
session allocation 194 0.0 0 171 0.0
session idle bit 281 0.0 0 0
session queue latch 1 0.0 0 0
session state list latch 14 0.0 0 0
session switching 61 0.0 0 0
session timer 100 0.0 0 0
shared pool 741 0.0 0 0
shared pool sim alloc 1 0.0 0 0
shared pool simulator 84 0.0 0 0
sim partition latch 1 0.0 0 0
simulator hash latch 1 0.0 0 0
simulator lru latch 1 0.0 0 0
sort extent pool 6 0.0 0 0
space background task la 345 0.6 0.0 0 202 0.0
tablespace key chain 1 0.0 0 0
Latch Activity DB/Inst: XE/XE Snaps: 13-14
->"Get Requests", "Pct Get Miss" and "Avg Slps/Miss" are statistics for
willing-to-wait latch get requests
->"NoWait Requests", "Pct NoWait Miss" are for no-wait latch get requests
->"Pct Misses" for both should be very close to 0.0
Pct Avg Wait Pct
Get Get Slps Time NoWait NoWait
Latch Requests Miss /Miss (s) Requests Miss
------------------------ -------------- ------ ------ ------ ------------ ------
test excl. parent l0 1 0.0 0 0
test excl. parent2 l0 1 0.0 0 0
third spare latch 1 0.0 0 0
threshold alerts latch 6 0.0 0 0
transaction allocation 16 0.0 0 0
undo global data 1,647 0.0 0 0
virtual circuit buffers 1 0.0 0 0
virtual circuit holder 1 0.0 0 0
virtual circuit queues 1 0.0 0 0
-------------------------------------------------------------
Latch Sleep breakdown DB/Inst: XE/XE Snaps: 13-14
-> ordered by misses desc
Get Spin
Latch Name Requests Misses Sleeps Gets
-------------------------- --------------- ------------ ----------- -----------
In memory undo latch 36,893 3 3 0
-------------------------------------------------------------
Latch Miss Sources DB/Inst: XE/XE Snaps: 13-14
-> only latches with sleeps are shown
-> ordered by name, sleeps desc
NoWait Waiter
Latch Name Where Misses Sleeps Sleeps
------------------------ -------------------------- ------- ---------- --------
In memory undo latch ktiFlush: child 0 3 0
-------------------------------------------------------------
Dictionary Cache Stats DB/Inst: XE/XE Snaps: 13-14
->"Pct Misses" should be very low (< 2% in most cases)
->"Final Usage" is the number of cache entries being used in End Snapshot
Get Pct Scan Pct Mod Final
Cache Requests Miss Reqs Miss Reqs Usage
------------------------- ------------ ------ ------- ----- -------- ----------
dc_awr_control 5 0.0 0 0 1
dc_global_oids 30 0.0 0 0 34
dc_objects 31 0.0 0 0 1,590
dc_profiles 1 0.0 0 0 1
dc_rollback_segments 43 0.0 0 0 22
dc_tablespaces 33 0.0 0 0 7
dc_users 137 0.0 0 0 59
global database name 203 0.0 0 0 1
-------------------------------------------------------------
Library Cache Activity DB/Inst: XE/XE Snaps: 13-14
->"Pct Misses" should be very low
Get Pct Pin Pct Invali-
Namespace Requests Miss Requests Miss Reloads dations
--------------- ------------ ------ -------------- ------ ---------- --------
ACCOUNT_STATUS 2 0.0 0 0 0
BODY 7 0.0 18 0.0 0 0
DBLINK 2 0.0 0 0 0
EDITION 1 0.0 2 0.0 0 0
SCHEMA 1 0.0 0 0 0
SQL AREA 23 0.0 4,105 0.0 0 0
TABLE/PROCEDURE 14 0.0 35 0.0 0 0
-------------------------------------------------------------
Rule Sets DB/Inst: XE/XE Snaps: 13-14
-> * indicates Rule Set activity (re)started between Begin/End snaps
-> Top 25 ordered by Evaluations desc
No-SQL SQL
Rule * Eval/sec Reloads/sec Eval % Eval %
----------------------------------- - ------------ ----------- ------ ------
SYS.ALERT_QUE_R 0 0 0 0
-------------------------------------------------------------
Shared Pool Advisory DB/Inst: XE/XE End Snap: 14
-> SP: Shared Pool Est LC: Estimated Library Cache Factr: Factor
-> Note there is often a 1:Many correlation between a single logical object
in the Library Cache, and the physical number of memory objects associated
with it. Therefore comparing the number of Lib Cache objects (e.g. in
v$librarycache), with the number of Lib Cache Memory Objects is invalid
Est LC Est LC Est LC Est LC
Shared SP Est LC Time Time Load Load Est LC
Pool Size Size Est LC Saved Saved Time Time Mem
Size (M) Factr (M) Mem Obj (s) Factr (s) Factr Obj Hits
---------- ----- -------- ------------ ------- ------ ------- ------ -----------
128 .8 5 413 3,134 1.0 43 1.7 14,398
148 .9 25 1,914 3,139 1.0 38 1.5 54,776
168 1.0 43 3,083 3,151 1.0 26 1.0 55,144
188 1.1 54 3,644 3,151 1.0 26 1.0 55,150
208 1.2 54 3,644 3,151 1.0 26 1.0 55,150
228 1.4 54 3,644 3,151 1.0 26 1.0 55,150
248 1.5 54 3,644 3,151 1.0 26 1.0 55,150
268 1.6 54 3,644 3,151 1.0 26 1.0 55,150
288 1.7 54 3,644 3,151 1.0 26 1.0 55,150
308 1.8 54 3,644 3,151 1.0 26 1.0 55,150
328 2.0 54 3,644 3,151 1.0 26 1.0 55,150
348 2.1 54 3,644 3,151 1.0 26 1.0 55,150
-------------------------------------------------------------
SGA Target Advisory DB/Inst: XE/XE End Snap: 14
SGA Target SGA Size Est DB Est DB Est Physical
Size (M) Factor Time (s) Time Factor Reads
---------- -------- -------- ----------- --------------
306 .5 9,049 1.0
459 .8 9,049 1.0
612 1.0 9,049 1.0
765 1.3 9,049 1.0
918 1.5 9,049 1.0
1,071 1.8 9,049 1.0
1,224 2.0 9,049 1.0
-------------------------------------------------------------
SGA Memory Summary DB/Inst: XE/XE Snaps: 13-14
End Size (Bytes)
SGA regions Begin Size (Bytes) (if different)
------------------------------ -------------------- --------------------
Database Buffers 444,596,224
Fixed Size 2,233,344
Redo Buffers 5,541,888
Variable Size 616,565,760
-------------------- --------------------
sum 1,068,937,216
-------------------------------------------------------------
SGA breakdown difference DB/Inst: XE/XE Snaps: 13-14
-> Top 35 rows by size, ordered by Pool, Name (note rows with null values for
Pool column, or Names showing free memory are always shown)
-> Null value for Begin MB or End MB indicates the size of that Pool/Name was
insignificant, or zero in that snapshot
Pool Name Begin MB End MB % Diff
------ ------------------------------ -------------- -------------- --------
java p free memory 4.0 4.0 0.00
large PX msg pool 3.7 3.7 0.00
large free memory .3 .3 0.00
shared ASH buffers 8.0 8.0 0.00
shared FileOpenBlock 3.8 3.8 0.00
shared KCB Table Scan Buffer 3.8 3.8 0.00
shared KGLH0 26.3 26.3 0.00
shared KGLHD 3.8 3.8 0.00
shared KGLS 4.0 4.0 0.00
shared KGLSG 5.0 5.0 0.00
shared KSFD SGA I/O b 3.8 3.8 0.00
shared PLMCD 2.6 2.6 0.00
shared SQLA 15.9 15.9 0.00
shared db_block_hash_buckets 2.8 2.8 0.00
shared dbwriter coalesce buffer 3.8 3.8 0.00
shared dirty object counts array 2.0 2.0 0.00
shared event statistics per sess 2.1 2.1 0.00
shared free memory 23.1 23.9 3.67
shared kglsim hash table bkts 4.0 4.0 0.00
shared ksunfy : SSO free list 2.0 2.0 0.00
shared obj stats allocation chun 2.5 2.5 0.00
shared private strands 2.3 2.3 0.00
shared row cache 7.2 7.2 0.00
shared write state object 2.2 2.2 0.00
buffer_cache 424.0 424.0 0.00
fixed_sga 2.1 2.1 0.00
log_buffer 5.3 5.3 0.00
-------------------------------------------------------------
SQL Memory Statistics DB/Inst: XE/XE Snaps: 13-14
Begin End % Diff
-------------- -------------- --------------
Avg Cursor Size (KB): 27.57 27.57 .00
Cursor to Parent ratio: 1.08 1.08 .00
Total Cursors: 758 758 .00
Total Parents: 700 700 .00
-------------------------------------------------------------
init.ora Parameters DB/Inst: XE/XE Snaps: 13-14
End value
Parameter Name Begin value (if different)
----------------------------- --------------------------------- --------------
audit_file_dest /u01/app/oracle/admin/XE/adump
compatible 11.2.0.0.0
control_files /mnt/myrbd/XE/control.dbf
db_cache_advice READY
db_file_multiblock_read_count 64
db_keep_cache_size 0
db_name XE
db_recycle_cache_size 0
diagnostic_dest /u01/app/oracle
disk_asynch_io TRUE
dispatchers (PROTOCOL=TCP) (SERVICE=XEXDB)
filesystemio_options setall
job_queue_processes 4
memory_target 1073741824
open_cursors 300
processes 100
remote_login_passwordfile EXCLUSIVE
resource_limit TRUE
resource_manager_plan FORCE:
sessions 172
shared_servers 4
undo_management AUTO
undo_retention 90
undo_tablespace UNDOTBS1
-------------------------------------------------------------
End of Report ( /home/oracle/slob/SLOB/testreports/1613157226/1613157226.rpt )И с работой xe-субд, с образом бд видимом ч/з псевдоустройство /dev/cas1-0;
Cтатспак-отчёт, для этого теста.
STATSPACK report for
Database DB Id Instance Inst Num Startup Time Release RAC
~~~~~~~~ ----------- ------------ -------- --------------- ----------- ---
2945358617 XE 1 12-Feb-21 20:40 11.2.0.2.0 NO
Host Name Platform CPUs Cores Sockets Memory (G)
~~~~ ---------------- ---------------------- ----- ----- ------- ------------
devdb Linux x86 64-bit 4 2 1 7.6
Snapshot Snap Id Snap Time Sessions Curs/Sess Comment
~~~~~~~~ ---------- ------------------ -------- --------- ------------------
Begin Snap: 15 12-Feb-21 20:40:55 31 1.9
End Snap: 16 12-Feb-21 20:46:25 23 1.3
Elapsed: 5.50 (mins) Av Act Sess: 9.1
DB time: 49.82 (mins) DB CPU: 2.72 (mins)
Cache Sizes Begin End
~~~~~~~~~~~ ---------- ----------
Buffer Cache: 424M Std Block Size: 8K
Shared Pool: 168M Log Buffer: 5,148K
Load Profile Per Second Per Transaction Per Exec Per Call
~~~~~~~~~~~~ ------------------ ----------------- ----------- -----------
DB time(s): 9.1 2.0 0.07 17.08
DB CPU(s): 0.5 0.1 0.00 0.93
Redo size: 246,757.4 53,572.3
Logical reads: 115,906.5 25,163.9
Block changes: 605.8 131.5
Physical reads: 114,866.7 24,938.2
Physical writes: 283.0 61.4
User calls: 0.5 0.1
Parses: 2.1 0.5
Hard parses: 0.5 0.1
W/A MB processed: 0.1 0.0
Logons: 0.0 0.0
Executes: 121.3 26.3
Rollbacks: 0.0 0.0
Transactions: 4.6
Instance Efficiency Indicators
~~~~~~~~~~~~~~~~~~~~~~~~~~~~~~
Buffer Nowait %: 100.00 Redo NoWait %: 100.00
Buffer Hit %: 25.13 Optimal W/A Exec %: 100.00
Library Hit %: 96.98 Soft Parse %: 77.25
Execute to Parse %: 98.25 Latch Hit %: 99.98
Parse CPU to Parse Elapsd %: 3.92 % Non-Parse CPU: 99.88
Shared Pool Statistics Begin End
------ ------
Memory Usage %: 69.02 74.50
% SQL with executions>1: 51.15 59.79
% Memory for SQL w/exec>1: 51.34 64.15
Top 5 Timed Events Avg %Total
~~~~~~~~~~~~~~~~~~ wait Call
Event Waits Time (s) (ms) Time
----------------------------------------- ------------ ----------- ------ ------
db file sequential read 848,239 1,717 2 56.3
direct path read 536,205 1,018 2 33.4
CPU time 163 5.4
resmgr:cpu quantum 67,343 93 1 3.0
db file parallel read 6,332 24 4 .8
-------------------------------------------------------------
Host CPU (CPUs: 4 Cores: 2 Sockets: 1)
~~~~~~~~ Load Average
Begin End User System Idle WIO WCPU
------- ------- ------- ------- ------- ------- --------
0.11 3.91 4.32 8.70 86.19 61.12
Instance CPU
~~~~~~~~~~~~ % Time (seconds)
-------- --------------
Host: Total time (s): 1,265.9
Host: Busy CPU time (s): 174.9
% of time Host is Busy: 13.8
Instance: Total CPU time (s): 165.6
% of Busy CPU used for Instance: 94.7
Instance: Total Database time (s): 3,001.8
%DB time waiting for CPU (Resource Mgr): 0.0
Virtual Memory Paging
~~~~~~~~~~~~~~~~~~~~~
KB paged out per sec: 14,818.5
KB paged in per sec: 1,843,326.3
Memory Statistics Begin End
~~~~~~~~~~~~~~~~~ ------------ ------------
Host Mem (MB): 7,812.1 7,812.1
SGA use (MB): 1,019.4 1,019.4
PGA use (MB): 106.7 59.7
% Host Mem used for SGA+PGA: 14.4 13.8
-------------------------------------------------------------
Time Model System Stats DB/Inst: XE/XE Snaps: 15-16
-> Ordered by % of DB time desc, Statistic name
Statistic Time (s) % DB time
----------------------------------- -------------------- ---------
sql execute elapsed time 2,988.9 100.0
DB CPU 163.4 5.5
parse time elapsed 0.8 .0
hard parse elapsed time 0.8 .0
PL/SQL execution elapsed time 0.7 .0
hard parse (sharing criteria) elaps 0.3 .0
connection management call elapsed 0.0 .0
PL/SQL compilation elapsed time 0.0 .0
failed parse elapsed time 0.0 .0
repeated bind elapsed time 0.0 .0
DB time 2,989.0
background elapsed time 12.8
background cpu time 2.3
-------------------------------------------------------------
Foreground Wait Events DB/Inst: XE/XE Snaps: 15-16
-> Only events with Total Wait Time (s) >= .001 are shown
-> ordered by Total Wait Time desc, Waits desc (idle events last)
Avg %Total
%Tim Total Wait wait Waits Call
Event Waits out Time (s) (ms) /txn Time
---------------------------- ------------ ---- ---------- ------ -------- ------
db file sequential read 848,187 0 1,717 2 558.0 56.3
direct path read 536,202 0 1,018 2 352.8 33.4
resmgr:cpu quantum 67,343 0 93 1 44.3 3.0
db file parallel read 6,314 0 24 4 4.2 .8
db file scattered read 3,640 0 22 6 2.4 .7
cursor: pin S wait on X 4 0 1 238 0.0 .0
control file sequential read 306 0 0 0 0.2 .0
enq: KO - fast object checkp 5 0 0 2 0.0 .0
read by other session 14 0 0 1 0.0 .0
latch: In memory undo latch 70 0 0 0 0.0 .0
Disk file operations I/O 19 0 0 0 0.0 .0
asynch descriptor resize 2,691 100 0 0 1.8 .0
log file sync 1 0 0 1 0.0 .0
SQL*Net message from client 117 0 5 39 0.1
-------------------------------------------------------------
Background Wait Events DB/Inst: XE/XE Snaps: 15-16
-> Only events with Total Wait Time (s) >= .001 are shown
-> ordered by Total Wait Time desc, Waits desc (idle events last)
Avg %Total
%Tim Total Wait wait Waits Call
Event Waits out Time (s) (ms) /txn Time
---------------------------- ------------ ---- ---------- ------ -------- ------
log file parallel write 1,561 0 4 3 1.0 .1
db file parallel write 5,476 0 3 1 3.6 .1
control file sequential read 224 0 1 2 0.1 .0
db file parallel read 18 0 0 12 0.0 .0
control file parallel write 134 0 0 1 0.1 .0
db file sequential read 52 0 0 2 0.0 .0
db file scattered read 23 0 0 3 0.0 .0
os thread startup 2 0 0 21 0.0 .0
log file sequential read 4 0 0 4 0.0 .0
Disk file operations I/O 2 0 0 3 0.0 .0
log file single write 4 0 0 1 0.0 .0
direct path read 3 0 0 1 0.0 .0
direct path write 1 0 0 1 0.0 .0
rdbms ipc message 3,245 37 3,037 936 2.1
shared server idle wait 44 100 1,320 30008 0.0
DIAG idle wait 658 100 658 1000 0.4
dispatcher timer 6 100 360 60009 0.0
Streams AQ: qmn slave idle w 12 0 336 28006 0.0
Streams AQ: qmn coordinator 24 50 336 14003 0.0
pmon timer 108 100 327 3029 0.1
smon timer 1 100 300 ###### 0.0
Space Manager: slave idle wa 7 100 35 5000 0.0
SQL*Net message from client 37 0 0 1 0.0
-------------------------------------------------------------
Wait Events (fg and bg) DB/Inst: XE/XE Snaps: 15-16
-> s - second, cs - centisecond, ms - millisecond, us - microsecond
-> %Timeouts: value of 0 indicates value was < .5%. Value of null is truly 0
-> Only events with Total Wait Time (s) >= .001 are shown
-> ordered by Total Wait Time desc, Waits desc (idle events last)
Avg %Total
%Tim Total Wait wait Waits Call
Event Waits out Time (s) (ms) /txn Time
---------------------------- ------------ ---- ---------- ------ -------- ------
db file sequential read 848,239 0 1,717 2 558.1 56.3
direct path read 536,205 0 1,018 2 352.8 33.4
resmgr:cpu quantum 67,343 0 93 1 44.3 3.0
db file parallel read 6,332 0 24 4 4.2 .8
db file scattered read 3,663 0 22 6 2.4 .7
log file parallel write 1,561 0 4 3 1.0 .1
db file parallel write 5,476 0 3 1 3.6 .1
cursor: pin S wait on X 4 0 1 238 0.0 .0
control file sequential read 530 0 1 1 0.3 .0
control file parallel write 134 0 0 1 0.1 .0
os thread startup 2 0 0 21 0.0 .0
log file sequential read 4 0 0 4 0.0 .0
Disk file operations I/O 21 0 0 1 0.0 .0
enq: KO - fast object checkp 5 0 0 2 0.0 .0
read by other session 14 0 0 1 0.0 .0
latch: In memory undo latch 70 0 0 0 0.0 .0
asynch descriptor resize 2,699 100 0 0 1.8 .0
log file single write 4 0 0 1 0.0 .0
log file sync 1 0 0 1 0.0 .0
direct path write 1 0 0 1 0.0 .0
rdbms ipc message 3,245 37 3,037 936 2.1
shared server idle wait 44 100 1,320 30008 0.0
DIAG idle wait 658 100 658 1000 0.4
dispatcher timer 6 100 360 60009 0.0
Streams AQ: qmn slave idle w 12 0 336 28006 0.0
Streams AQ: qmn coordinator 24 50 336 14003 0.0
pmon timer 108 100 327 3029 0.1
smon timer 1 100 300 ###### 0.0
Space Manager: slave idle wa 7 100 35 5000 0.0
SQL*Net message from client 154 0 5 30 0.1
-------------------------------------------------------------
Wait Event Histogram DB/Inst: XE/XE Snaps: 15-16
-> Total Waits - units: K is 1000, M is 1000000, G is 1000000000
-> % of Waits - column heading: <=1s is truly <1024ms, >1s is truly >=1024ms
-> % of Waits - value: .0 indicates value was <.05%, null is truly 0
-> Ordered by Event (idle events last)
Total ----------------- % of Waits ------------------
Event Waits <1ms <2ms <4ms <8ms <16ms <32ms <=1s >1s
-------------------------- ----- ----- ----- ----- ----- ----- ----- ----- -----
Disk file operations I/O 21 90.5 4.8 4.8
LGWR wait for redo copy 3 100.0
SQL*Net break/reset to cli 6 100.0
asynch descriptor resize 2699 100.0
control file parallel writ 134 44.0 40.3 11.2 4.5
control file sequential re 530 67.9 7.0 19.1 5.8 .2
cursor: pin S wait on X 6 16.7 83.3
db file parallel read 6332 11.9 24.5 36.1 14.2 12.1 1.0 .0
db file parallel write 5476 85.4 5.2 5.0 3.6 .6 .1
db file scattered read 3651 .1 3.0 40.9 37.3 14.3 4.4
db file sequential read 848K 24.1 39.7 27.9 6.6 1.7 .0 .0
direct path read 536K 31.0 30.6 31.0 7.3 .1 .0 .0
direct path write 1 100.0
enq: KO - fast object chec 5 80.0 20.0
latch free 2 100.0
latch: In memory undo latc 70 100.0
latch: cache buffers lru c 1 100.0
latch: call allocation 1 100.0
latch: object queue header 4 100.0
latch: redo allocation 4 100.0
latch: shared pool 1 100.0
library cache: mutex X 5 100.0
log file parallel write 1561 .3 37.3 42.4 18.8 1.2
log file sequential read 4 75.0 25.0
log file single write 4 50.0 50.0
log file sync 1 100.0
os thread startup 2 100.0
read by other session 14 85.7 14.3
reliable message 5 100.0
resmgr:cpu quantum 67K 84.2 .7 1.9 7.4 5.1 .7 .0
DIAG idle wait 658 100.0
SQL*Net message from clien 154 94.2 4.5 1.3
SQL*Net message to client 148 100.0
Space Manager: slave idle 7 100.0
Streams AQ: qmn coordinato 24 50.0 50.0
Streams AQ: qmn slave idle 12 100.0
class slave wait 1 100.0
dispatcher timer 6 100.0
pmon timer 109 100.0
rdbms ipc message 3244 5.6 .6 1.1 1.7 3.0 4.8 58.0 25.3
shared server idle wait 44 100.0
smon timer 1 100.0
-------------------------------------------------------------
SQL ordered by CPU DB/Inst: XE/XE Snaps: 15-16
-> Total DB CPU (s): 163
-> Captured SQL accounts for 198.3% of Total DB CPU
-> SQL reported below exceeded 1.0% of Total DB CPU
CPU CPU per Elapsd Old
Time (s) Executions Exec (s) %Total Time (s) Buffer Gets Hash Value
---------- ------------ ---------- ------ ---------- --------------- ----------
95.08 17,990 0.01 58.2 1140.11 36,899,541 2922983071
Module: SQL*Plus
SELECT COUNT(C2) FROM CF2
58.26 18,211 0.00 35.7 1673.06 1,186,271 1900182548
Module: SQL*Plus
SELECT COUNT(C2) FROM CF1 WHERE ( CUSTID > ( :B1 - :B2 ) ) AND (
CUSTID < :B1 )
27.74 1 27.74 17.0 298.74 9,040,265 3562924056
Module: SQL*Plus
DECLARE v_default_schema_number PLS_INTEGER := '1'; v_update_pct
PLS_INTEGER := '4'; v_max_loop_iterations PLS_INTEGER := '0'; v
_seconds_to_run PLS_INTEGER := '300'; v_scale PLS_INTEGER := '32
768'; v_work_unit PLS_INTEGER := '64' ; v_redo_stress VARCHAR2(
15.19 1 15.19 9.3 298.73 3,317,805 72207027
Module: SQL*Plus
DECLARE v_default_schema_number PLS_INTEGER := '3'; v_update_pct
PLS_INTEGER := '4'; v_max_loop_iterations PLS_INTEGER := '0'; v
_seconds_to_run PLS_INTEGER := '300'; v_scale PLS_INTEGER := '32
768'; v_work_unit PLS_INTEGER := '64' ; v_redo_stress VARCHAR2(
15.14 1 15.14 9.3 298.71 3,270,483 203624297
Module: SQL*Plus
DECLARE v_default_schema_number PLS_INTEGER := '7'; v_update_pct
PLS_INTEGER := '4'; v_max_loop_iterations PLS_INTEGER := '0'; v
_seconds_to_run PLS_INTEGER := '300'; v_scale PLS_INTEGER := '32
768'; v_work_unit PLS_INTEGER := '64' ; v_redo_stress VARCHAR2(
15.06 1 15.06 9.2 300.19 3,263,185 3879266389
Module: SQL*Plus
DECLARE v_default_schema_number PLS_INTEGER := '6'; v_update_pct
PLS_INTEGER := '4'; v_max_loop_iterations PLS_INTEGER := '0'; v
_seconds_to_run PLS_INTEGER := '300'; v_scale PLS_INTEGER := '32
768'; v_work_unit PLS_INTEGER := '64' ; v_redo_stress VARCHAR2(
15.04 1 15.04 9.2 298.70 3,253,232 1815383075
Module: SQL*Plus
DECLARE v_default_schema_number PLS_INTEGER := '9'; v_update_pct
PLS_INTEGER := '4'; v_max_loop_iterations PLS_INTEGER := '0'; v
_seconds_to_run PLS_INTEGER := '300'; v_scale PLS_INTEGER := '32
768'; v_work_unit PLS_INTEGER := '64' ; v_redo_stress VARCHAR2(
15.02 1 15.02 9.2 298.55 3,251,836 2698804698
Module: SQL*Plus
DECLARE v_default_schema_number PLS_INTEGER := '10'; v_update_pc
t PLS_INTEGER := '4'; v_max_loop_iterations PLS_INTEGER := '0';
v_seconds_to_run PLS_INTEGER := '300'; v_scale PLS_INTEGER := '3
2768'; v_work_unit PLS_INTEGER := '64' ; v_redo_stress VARCHAR2
14.94 1 14.94 9.1 298.27 3,270,149 3125669980
SQL ordered by CPU DB/Inst: XE/XE Snaps: 15-16
-> Total DB CPU (s): 163
-> Captured SQL accounts for 198.3% of Total DB CPU
-> SQL reported below exceeded 1.0% of Total DB CPU
CPU CPU per Elapsd Old
Time (s) Executions Exec (s) %Total Time (s) Buffer Gets Hash Value
---------- ------------ ---------- ------ ---------- --------------- ----------
Module: SQL*Plus
DECLARE v_default_schema_number PLS_INTEGER := '2'; v_update_pct
PLS_INTEGER := '4'; v_max_loop_iterations PLS_INTEGER := '0'; v
_seconds_to_run PLS_INTEGER := '300'; v_scale PLS_INTEGER := '32
768'; v_work_unit PLS_INTEGER := '64' ; v_redo_stress VARCHAR2(
14.94 1 14.94 9.1 298.71 3,235,127 2294594620
Module: SQL*Plus
DECLARE v_default_schema_number PLS_INTEGER := '5'; v_update_pct
PLS_INTEGER := '4'; v_max_loop_iterations PLS_INTEGER := '0'; v
_seconds_to_run PLS_INTEGER := '300'; v_scale PLS_INTEGER := '32
768'; v_work_unit PLS_INTEGER := '64' ; v_redo_stress VARCHAR2(
14.83 1 14.83 9.1 300.18 3,166,074 1410152490
Module: SQL*Plus
DECLARE v_default_schema_number PLS_INTEGER := '4'; v_update_pct
PLS_INTEGER := '4'; v_max_loop_iterations PLS_INTEGER := '0'; v
_seconds_to_run PLS_INTEGER := '300'; v_scale PLS_INTEGER := '32
768'; v_work_unit PLS_INTEGER := '64' ; v_redo_stress VARCHAR2(
14.71 1 14.71 9.0 300.30 3,176,427 3704050312
Module: SQL*Plus
DECLARE v_default_schema_number PLS_INTEGER := '8'; v_update_pct
PLS_INTEGER := '4'; v_max_loop_iterations PLS_INTEGER := '0'; v
_seconds_to_run PLS_INTEGER := '300'; v_scale PLS_INTEGER := '32
768'; v_work_unit PLS_INTEGER := '64' ; v_redo_stress VARCHAR2(
7.07 1,505 0.00 4.3 156.56 109,601 789159957
Module: SQL*Plus
UPDATE CF1 SET C2 = :B3 , C20 = :B3 WHERE ( CUSTID > ( :B1 - :B2
)) AND (CUSTID < :B1 )
-------------------------------------------------------------
SQL ordered by Elapsed time for DB: XE Instance: XE Snaps: 15 -16
-> Total DB Time (s): 2,989
-> Captured SQL accounts for 199.6% of Total DB Time
-> SQL reported below exceeded 1.0% of Total DB Time
Elapsed Elap per CPU Old
Time (s) Executions Exec (s) %Total Time (s) Physical Reads Hash Value
---------- ------------ ---------- ------ ---------- --------------- ----------
1673.06 18,211 0.09 56.0 58.26 927,610 1900182548
Module: SQL*Plus
SELECT COUNT(C2) FROM CF1 WHERE ( CUSTID > ( :B1 - :B2 ) ) AND (
CUSTID < :B1 )
1140.11 17,990 0.06 38.1 95.08 36,845,568 2922983071
Module: SQL*Plus
SELECT COUNT(C2) FROM CF2
300.30 1 300.30 10.0 14.71 3,157,217 3704050312
Module: SQL*Plus
DECLARE v_default_schema_number PLS_INTEGER := '8'; v_update_pct
PLS_INTEGER := '4'; v_max_loop_iterations PLS_INTEGER := '0'; v
_seconds_to_run PLS_INTEGER := '300'; v_scale PLS_INTEGER := '32
768'; v_work_unit PLS_INTEGER := '64' ; v_redo_stress VARCHAR2(
300.19 1 300.19 10.0 15.06 3,244,024 3879266389
Module: SQL*Plus
DECLARE v_default_schema_number PLS_INTEGER := '6'; v_update_pct
PLS_INTEGER := '4'; v_max_loop_iterations PLS_INTEGER := '0'; v
_seconds_to_run PLS_INTEGER := '300'; v_scale PLS_INTEGER := '32
768'; v_work_unit PLS_INTEGER := '64' ; v_redo_stress VARCHAR2(
300.18 1 300.18 10.0 14.83 3,148,366 1410152490
Module: SQL*Plus
DECLARE v_default_schema_number PLS_INTEGER := '4'; v_update_pct
PLS_INTEGER := '4'; v_max_loop_iterations PLS_INTEGER := '0'; v
_seconds_to_run PLS_INTEGER := '300'; v_scale PLS_INTEGER := '32
768'; v_work_unit PLS_INTEGER := '64' ; v_redo_stress VARCHAR2(
298.74 1 298.74 10.0 27.74 8,880,859 3562924056
Module: SQL*Plus
DECLARE v_default_schema_number PLS_INTEGER := '1'; v_update_pct
PLS_INTEGER := '4'; v_max_loop_iterations PLS_INTEGER := '0'; v
_seconds_to_run PLS_INTEGER := '300'; v_scale PLS_INTEGER := '32
768'; v_work_unit PLS_INTEGER := '64' ; v_redo_stress VARCHAR2(
298.73 1 298.73 10.0 15.19 3,296,303 72207027
Module: SQL*Plus
DECLARE v_default_schema_number PLS_INTEGER := '3'; v_update_pct
PLS_INTEGER := '4'; v_max_loop_iterations PLS_INTEGER := '0'; v
_seconds_to_run PLS_INTEGER := '300'; v_scale PLS_INTEGER := '32
768'; v_work_unit PLS_INTEGER := '64' ; v_redo_stress VARCHAR2(
298.71 1 298.71 10.0 15.14 3,249,612 203624297
Module: SQL*Plus
DECLARE v_default_schema_number PLS_INTEGER := '7'; v_update_pct
PLS_INTEGER := '4'; v_max_loop_iterations PLS_INTEGER := '0'; v
_seconds_to_run PLS_INTEGER := '300'; v_scale PLS_INTEGER := '32
768'; v_work_unit PLS_INTEGER := '64' ; v_redo_stress VARCHAR2(
298.71 1 298.71 10.0 14.94 3,216,212 2294594620
SQL ordered by Elapsed time for DB: XE Instance: XE Snaps: 15 -16
-> Total DB Time (s): 2,989
-> Captured SQL accounts for 199.6% of Total DB Time
-> SQL reported below exceeded 1.0% of Total DB Time
Elapsed Elap per CPU Old
Time (s) Executions Exec (s) %Total Time (s) Physical Reads Hash Value
---------- ------------ ---------- ------ ---------- --------------- ----------
Module: SQL*Plus
DECLARE v_default_schema_number PLS_INTEGER := '5'; v_update_pct
PLS_INTEGER := '4'; v_max_loop_iterations PLS_INTEGER := '0'; v
_seconds_to_run PLS_INTEGER := '300'; v_scale PLS_INTEGER := '32
768'; v_work_unit PLS_INTEGER := '64' ; v_redo_stress VARCHAR2(
298.70 1 298.70 10.0 15.04 3,233,857 1815383075
Module: SQL*Plus
DECLARE v_default_schema_number PLS_INTEGER := '9'; v_update_pct
PLS_INTEGER := '4'; v_max_loop_iterations PLS_INTEGER := '0'; v
_seconds_to_run PLS_INTEGER := '300'; v_scale PLS_INTEGER := '32
768'; v_work_unit PLS_INTEGER := '64' ; v_redo_stress VARCHAR2(
298.55 1 298.55 10.0 15.02 3,234,593 2698804698
Module: SQL*Plus
DECLARE v_default_schema_number PLS_INTEGER := '10'; v_update_pc
t PLS_INTEGER := '4'; v_max_loop_iterations PLS_INTEGER := '0';
v_seconds_to_run PLS_INTEGER := '300'; v_scale PLS_INTEGER := '3
2768'; v_work_unit PLS_INTEGER := '64' ; v_redo_stress VARCHAR2
298.27 1 298.27 10.0 14.94 3,248,679 3125669980
Module: SQL*Plus
DECLARE v_default_schema_number PLS_INTEGER := '2'; v_update_pct
PLS_INTEGER := '4'; v_max_loop_iterations PLS_INTEGER := '0'; v
_seconds_to_run PLS_INTEGER := '300'; v_scale PLS_INTEGER := '32
768'; v_work_unit PLS_INTEGER := '64' ; v_redo_stress VARCHAR2(
156.56 1,505 0.10 5.2 7.07 79,655 789159957
Module: SQL*Plus
UPDATE CF1 SET C2 = :B3 , C20 = :B3 WHERE ( CUSTID > ( :B1 - :B2
)) AND (CUSTID < :B1 )
-------------------------------------------------------------
SQL ordered by Gets DB/Inst: XE/XE Snaps: 15-16
-> End Buffer Gets Threshold: 10000 Total Buffer Gets: 38,249,156
-> Captured SQL accounts for 99.9% of Total Buffer Gets
-> SQL reported below exceeded 1.0% of Total Buffer Gets
CPU Elapsd Old
Buffer Gets Executions Gets per Exec %Total Time (s) Time (s) Hash Value
--------------- ------------ -------------- ------ -------- --------- ----------
36,899,541 17,990 2,051.1 ###### 95.08 1140.11 2922983071
Module: SQL*Plus
SELECT COUNT(C2) FROM CF2
9,040,265 1 9,040,265.0 662.7 27.74 298.74 3562924056
Module: SQL*Plus
DECLARE v_default_schema_number PLS_INTEGER := '1'; v_update_pct
PLS_INTEGER := '4'; v_max_loop_iterations PLS_INTEGER := '0'; v
_seconds_to_run PLS_INTEGER := '300'; v_scale PLS_INTEGER := '32
768'; v_work_unit PLS_INTEGER := '64' ; v_redo_stress VARCHAR2(
3,317,805 1 3,317,805.0 243.2 15.19 298.73 72207027
Module: SQL*Plus
DECLARE v_default_schema_number PLS_INTEGER := '3'; v_update_pct
PLS_INTEGER := '4'; v_max_loop_iterations PLS_INTEGER := '0'; v
_seconds_to_run PLS_INTEGER := '300'; v_scale PLS_INTEGER := '32
768'; v_work_unit PLS_INTEGER := '64' ; v_redo_stress VARCHAR2(
3,270,483 1 3,270,483.0 239.8 15.14 298.71 203624297
Module: SQL*Plus
DECLARE v_default_schema_number PLS_INTEGER := '7'; v_update_pct
PLS_INTEGER := '4'; v_max_loop_iterations PLS_INTEGER := '0'; v
_seconds_to_run PLS_INTEGER := '300'; v_scale PLS_INTEGER := '32
768'; v_work_unit PLS_INTEGER := '64' ; v_redo_stress VARCHAR2(
3,270,149 1 3,270,149.0 239.7 14.94 298.27 3125669980
Module: SQL*Plus
DECLARE v_default_schema_number PLS_INTEGER := '2'; v_update_pct
PLS_INTEGER := '4'; v_max_loop_iterations PLS_INTEGER := '0'; v
_seconds_to_run PLS_INTEGER := '300'; v_scale PLS_INTEGER := '32
768'; v_work_unit PLS_INTEGER := '64' ; v_redo_stress VARCHAR2(
3,263,185 1 3,263,185.0 239.2 15.06 300.19 3879266389
Module: SQL*Plus
DECLARE v_default_schema_number PLS_INTEGER := '6'; v_update_pct
PLS_INTEGER := '4'; v_max_loop_iterations PLS_INTEGER := '0'; v
_seconds_to_run PLS_INTEGER := '300'; v_scale PLS_INTEGER := '32
768'; v_work_unit PLS_INTEGER := '64' ; v_redo_stress VARCHAR2(
3,253,232 1 3,253,232.0 238.5 15.04 298.70 1815383075
Module: SQL*Plus
DECLARE v_default_schema_number PLS_INTEGER := '9'; v_update_pct
PLS_INTEGER := '4'; v_max_loop_iterations PLS_INTEGER := '0'; v
_seconds_to_run PLS_INTEGER := '300'; v_scale PLS_INTEGER := '32
768'; v_work_unit PLS_INTEGER := '64' ; v_redo_stress VARCHAR2(
3,251,836 1 3,251,836.0 238.4 15.02 298.55 2698804698
Module: SQL*Plus
DECLARE v_default_schema_number PLS_INTEGER := '10'; v_update_pc
t PLS_INTEGER := '4'; v_max_loop_iterations PLS_INTEGER := '0';
v_seconds_to_run PLS_INTEGER := '300'; v_scale PLS_INTEGER := '3
2768'; v_work_unit PLS_INTEGER := '64' ; v_redo_stress VARCHAR2
SQL ordered by Gets DB/Inst: XE/XE Snaps: 15-16
-> End Buffer Gets Threshold: 10000 Total Buffer Gets: 38,249,156
-> Captured SQL accounts for 99.9% of Total Buffer Gets
-> SQL reported below exceeded 1.0% of Total Buffer Gets
CPU Elapsd Old
Buffer Gets Executions Gets per Exec %Total Time (s) Time (s) Hash Value
--------------- ------------ -------------- ------ -------- --------- ----------
3,235,127 1 3,235,127.0 237.2 14.94 298.71 2294594620
Module: SQL*Plus
DECLARE v_default_schema_number PLS_INTEGER := '5'; v_update_pct
PLS_INTEGER := '4'; v_max_loop_iterations PLS_INTEGER := '0'; v
_seconds_to_run PLS_INTEGER := '300'; v_scale PLS_INTEGER := '32
768'; v_work_unit PLS_INTEGER := '64' ; v_redo_stress VARCHAR2(
3,176,427 1 3,176,427.0 232.9 14.71 300.30 3704050312
Module: SQL*Plus
DECLARE v_default_schema_number PLS_INTEGER := '8'; v_update_pct
PLS_INTEGER := '4'; v_max_loop_iterations PLS_INTEGER := '0'; v
_seconds_to_run PLS_INTEGER := '300'; v_scale PLS_INTEGER := '32
768'; v_work_unit PLS_INTEGER := '64' ; v_redo_stress VARCHAR2(
3,166,074 1 3,166,074.0 232.1 14.83 300.18 1410152490
Module: SQL*Plus
DECLARE v_default_schema_number PLS_INTEGER := '4'; v_update_pct
PLS_INTEGER := '4'; v_max_loop_iterations PLS_INTEGER := '0'; v
_seconds_to_run PLS_INTEGER := '300'; v_scale PLS_INTEGER := '32
768'; v_work_unit PLS_INTEGER := '64' ; v_redo_stress VARCHAR2(
1,186,271 18,211 65.1 87.0 58.26 1673.06 1900182548
Module: SQL*Plus
SELECT COUNT(C2) FROM CF1 WHERE ( CUSTID > ( :B1 - :B2 ) ) AND (
CUSTID < :B1 )
-------------------------------------------------------------
SQL ordered by Reads DB/Inst: XE/XE Snaps: 15-16
-> End Disk Reads Threshold: 1000 Total Disk Reads: 37,906,002
-> Captured SQL accounts for 99.9% of Total Disk Reads
-> SQL reported below exceeded 1.0% of Total Disk Reads
CPU Elapsd
Physical Rds Executions Rds per Exec %Total Time (s) Time (s) Hash Value
--------------- ------------ -------------- ------ -------- --------- ----------
36,845,568 17,990 2,048.1 97.2 95.08 1140.11 2922983071
Module: SQL*Plus
SELECT COUNT(C2) FROM CF2
8,880,859 1 8,880,859.0 23.4 27.74 298.74 3562924056
Module: SQL*Plus
DECLARE v_default_schema_number PLS_INTEGER := '1'; v_update_pct
PLS_INTEGER := '4'; v_max_loop_iterations PLS_INTEGER := '0'; v
_seconds_to_run PLS_INTEGER := '300'; v_scale PLS_INTEGER := '32
768'; v_work_unit PLS_INTEGER := '64' ; v_redo_stress VARCHAR2(
3,296,303 1 3,296,303.0 8.7 15.19 298.73 72207027
Module: SQL*Plus
DECLARE v_default_schema_number PLS_INTEGER := '3'; v_update_pct
PLS_INTEGER := '4'; v_max_loop_iterations PLS_INTEGER := '0'; v
_seconds_to_run PLS_INTEGER := '300'; v_scale PLS_INTEGER := '32
768'; v_work_unit PLS_INTEGER := '64' ; v_redo_stress VARCHAR2(
3,249,612 1 3,249,612.0 8.6 15.14 298.71 203624297
Module: SQL*Plus
DECLARE v_default_schema_number PLS_INTEGER := '7'; v_update_pct
PLS_INTEGER := '4'; v_max_loop_iterations PLS_INTEGER := '0'; v
_seconds_to_run PLS_INTEGER := '300'; v_scale PLS_INTEGER := '32
768'; v_work_unit PLS_INTEGER := '64' ; v_redo_stress VARCHAR2(
3,248,679 1 3,248,679.0 8.6 14.94 298.27 3125669980
Module: SQL*Plus
DECLARE v_default_schema_number PLS_INTEGER := '2'; v_update_pct
PLS_INTEGER := '4'; v_max_loop_iterations PLS_INTEGER := '0'; v
_seconds_to_run PLS_INTEGER := '300'; v_scale PLS_INTEGER := '32
768'; v_work_unit PLS_INTEGER := '64' ; v_redo_stress VARCHAR2(
3,244,024 1 3,244,024.0 8.6 15.06 300.19 3879266389
Module: SQL*Plus
DECLARE v_default_schema_number PLS_INTEGER := '6'; v_update_pct
PLS_INTEGER := '4'; v_max_loop_iterations PLS_INTEGER := '0'; v
_seconds_to_run PLS_INTEGER := '300'; v_scale PLS_INTEGER := '32
768'; v_work_unit PLS_INTEGER := '64' ; v_redo_stress VARCHAR2(
3,234,593 1 3,234,593.0 8.5 15.02 298.55 2698804698
Module: SQL*Plus
DECLARE v_default_schema_number PLS_INTEGER := '10'; v_update_pc
t PLS_INTEGER := '4'; v_max_loop_iterations PLS_INTEGER := '0';
v_seconds_to_run PLS_INTEGER := '300'; v_scale PLS_INTEGER := '3
2768'; v_work_unit PLS_INTEGER := '64' ; v_redo_stress VARCHAR2
3,233,857 1 3,233,857.0 8.5 15.04 298.70 1815383075
Module: SQL*Plus
DECLARE v_default_schema_number PLS_INTEGER := '9'; v_update_pct
PLS_INTEGER := '4'; v_max_loop_iterations PLS_INTEGER := '0'; v
_seconds_to_run PLS_INTEGER := '300'; v_scale PLS_INTEGER := '32
768'; v_work_unit PLS_INTEGER := '64' ; v_redo_stress VARCHAR2(
SQL ordered by Reads DB/Inst: XE/XE Snaps: 15-16
-> End Disk Reads Threshold: 1000 Total Disk Reads: 37,906,002
-> Captured SQL accounts for 99.9% of Total Disk Reads
-> SQL reported below exceeded 1.0% of Total Disk Reads
CPU Elapsd
Physical Rds Executions Rds per Exec %Total Time (s) Time (s) Hash Value
--------------- ------------ -------------- ------ -------- --------- ----------
3,216,212 1 3,216,212.0 8.5 14.94 298.71 2294594620
Module: SQL*Plus
DECLARE v_default_schema_number PLS_INTEGER := '5'; v_update_pct
PLS_INTEGER := '4'; v_max_loop_iterations PLS_INTEGER := '0'; v
_seconds_to_run PLS_INTEGER := '300'; v_scale PLS_INTEGER := '32
768'; v_work_unit PLS_INTEGER := '64' ; v_redo_stress VARCHAR2(
3,157,217 1 3,157,217.0 8.3 14.71 300.30 3704050312
Module: SQL*Plus
DECLARE v_default_schema_number PLS_INTEGER := '8'; v_update_pct
PLS_INTEGER := '4'; v_max_loop_iterations PLS_INTEGER := '0'; v
_seconds_to_run PLS_INTEGER := '300'; v_scale PLS_INTEGER := '32
768'; v_work_unit PLS_INTEGER := '64' ; v_redo_stress VARCHAR2(
3,148,366 1 3,148,366.0 8.3 14.83 300.18 1410152490
Module: SQL*Plus
DECLARE v_default_schema_number PLS_INTEGER := '4'; v_update_pct
PLS_INTEGER := '4'; v_max_loop_iterations PLS_INTEGER := '0'; v
_seconds_to_run PLS_INTEGER := '300'; v_scale PLS_INTEGER := '32
768'; v_work_unit PLS_INTEGER := '64' ; v_redo_stress VARCHAR2(
927,610 18,211 50.9 2.4 58.26 1673.06 1900182548
Module: SQL*Plus
SELECT COUNT(C2) FROM CF1 WHERE ( CUSTID > ( :B1 - :B2 ) ) AND (
CUSTID < :B1 )
-------------------------------------------------------------
SQL ordered by Executions DB/Inst: XE/XE Snaps: 15-16
-> End Executions Threshold: 100 Total Executions: 40,026
-> Captured SQL accounts for 94.6% of Total Executions
-> SQL reported below exceeded 1.0% of Total Executions
CPU per Elap per Old
Executions Rows Processed Rows per Exec Exec (s) Exec (s) Hash Value
------------ --------------- ---------------- ----------- ---------- ----------
18,211 18,214 1.0 0.00 0.09 1900182548
Module: SQL*Plus
SELECT COUNT(C2) FROM CF1 WHERE ( CUSTID > ( :B1 - :B2 ) ) AND (
CUSTID < :B1 )
17,990 17,991 1.0 0.01 0.06 2922983071
Module: SQL*Plus
SELECT COUNT(C2) FROM CF2
1,505 94,815 63.0 0.00 0.10 789159957
Module: SQL*Plus
UPDATE CF1 SET C2 = :B3 , C20 = :B3 WHERE ( CUSTID > ( :B1 - :B2
)) AND (CUSTID < :B1 )
-------------------------------------------------------------
SQL ordered by Parse Calls DB/Inst: XE/XE Snaps: 15-16
-> End Parse Calls Threshold: 1000 Total Parse Calls: 699
-> Captured SQL accounts for 7.6% of Total Parse Calls
-> SQL reported below exceeded 1.0% of Total Parse Calls
% Total Old
Parse Calls Executions Parses Hash Value
------------ ------------ -------- ----------
8 55 1.14 4274598960
select /*+ rule */ bucket_cnt, row_cnt, cache_cnt, null_cnt, tim
estamp#, sample_size, minimum, maximum, distcnt, lowval, hival,
density, col#, spare1, spare2, avgcln from hist_head$ where obj#
=:1 and intcol#=:2
7 16 1.00 828281227
select obj#,type#,ctime,mtime,stime, status, dataobj#, flags, oi
d$, spare1, spare2 from obj$ where owner#=:1 and name=:2 and nam
espace=:3 and remoteowner is null and linkname is null and subna
me is null
-------------------------------------------------------------
Instance Activity Stats DB/Inst: XE/XE Snaps: 15-16
Statistic Total per Second per Trans
--------------------------------- ------------------ -------------- ------------
Batched IO (bound) vector count 7 0.0 0.0
Batched IO (full) vector count 10 0.0 0.0
Batched IO block miss count 1,695 5.1 1.1
Batched IO buffer defrag count 7 0.0 0.0
Batched IO double miss count 1 0.0 0.0
Batched IO same unit count 105 0.3 0.1
Batched IO vector block count 1,600 4.9 1.1
Batched IO vector read count 18 0.1 0.0
Block Cleanout Optim referenced 22 0.1 0.0
CCursor + sql area evicted 0 0.0 0.0
CPU used by this session 16,339 49.5 10.8
CPU used when call started 16,407 49.7 10.8
CR blocks created 12 0.0 0.0
Cached Commit SCN referenced 36,747,075 111,354.8 24,175.7
Commit SCN cached 10 0.0 0.0
DB time 300,588 910.9 197.8
DBWR checkpoint buffers written 2,374 7.2 1.6
DBWR checkpoints 6 0.0 0.0
DBWR tablespace checkpoint buffer 4 0.0 0.0
DBWR thread checkpoint buffers wr 2,370 7.2 1.6
DBWR transaction table writes 15 0.1 0.0
DBWR undo block writes 4,889 14.8 3.2
Effective IO time 1,017,961,836 3,084,732.8 669,711.7
HSC Heap Segment Block Changes 95,575 289.6 62.9
Heap Segment Array Inserts 60 0.2 0.0
IMU CR rollbacks 4 0.0 0.0
IMU Flushes 1,399 4.2 0.9
IMU Redo allocation size 13,199,612 39,998.8 8,684.0
IMU commits 119 0.4 0.1
IMU contention 1,398 4.2 0.9
IMU recursive-transaction flush 1 0.0 0.0
IMU undo allocation size 19,484,832 59,045.0 12,819.0
Number of read IOs issued 594,307 1,800.9 391.0
RowCR attempts 3 0.0 0.0
RowCR hits 3 0.0 0.0
SQL*Net roundtrips to/from client 117 0.4 0.1
active txn count during cleanout 58 0.2 0.0
application wait time 0 0.0 0.0
background checkpoints completed 1 0.0 0.0
background checkpoints started 2 0.0 0.0
background timeouts 1,215 3.7 0.8
buffer is not pinned count 1,195,608 3,623.1 786.6
buffer is pinned count 1,132,236 3,431.0 744.9
bytes received via SQL*Net from c 39,429 119.5 25.9
bytes sent via SQL*Net to client 41,557 125.9 27.3
calls to get snapshot scn: kcmgss 41,542 125.9 27.3
calls to kcmgas 1,592 4.8 1.1
calls to kcmgcs 54,408 164.9 35.8
cell physical IO interconnect byt 311,388,206,080 943,600,624.5 ############
change write time 55 0.2 0.0
cleanout - number of ktugct calls 72 0.2 0.1
cleanouts and rollbacks - consist 12 0.0 0.0
cleanouts only - consistent read 13 0.0 0.0
cluster key scan block gets 346 1.1 0.2
cluster key scans 316 1.0 0.2
commit cleanout failures: buffer 1 0.0 0.0
Instance Activity Stats DB/Inst: XE/XE Snaps: 15-16
Statistic Total per Second per Trans
--------------------------------- ------------------ -------------- ------------
commit cleanout failures: callbac 3 0.0 0.0
commit cleanouts 95,835 290.4 63.1
commit cleanouts successfully com 95,831 290.4 63.1
commit txn count during cleanout 35 0.1 0.0
concurrency wait time 81 0.3 0.1
consistent changes 16 0.1 0.0
consistent gets 38,138,850 115,572.3 25,091.4
consistent gets - examination 22,965 69.6 15.1
consistent gets direct 36,885,022 111,772.8 24,266.5
consistent gets from cache 1,253,828 3,799.5 824.9
consistent gets from cache (fastp 452,348 1,370.8 297.6
cursor authentications 41 0.1 0.0
data blocks consistent reads - un 12 0.0 0.0
db block changes 199,906 605.8 131.5
db block gets 110,244 334.1 72.5
db block gets from cache 110,244 334.1 72.5
db block gets from cache (fastpat 493 1.5 0.3
deferred (CURRENT) block cleanout 95,265 288.7 62.7
dirty buffers inspected 83,892 254.2 55.2
enqueue conversions 24 0.1 0.0
enqueue releases 3,474 10.5 2.3
enqueue requests 3,459 10.5 2.3
enqueue timeouts 1 0.0 0.0
enqueue waits 4 0.0 0.0
execute count 40,026 121.3 26.3
file io wait time 2,624,306,558 7,952,444.1 1,726,517.5
free buffer inspected 1,055,727 3,199.2 694.6
free buffer requested 1,025,700 3,108.2 674.8
heap block compress 2 0.0 0.0
hot buffers moved to head of LRU 107,169 324.8 70.5
immediate (CR) block cleanout app 25 0.1 0.0
immediate (CURRENT) block cleanou 53 0.2 0.0
index crx upgrade (positioned) 0 0.0 0.0
index fast full scans (full) 1 0.0 0.0
index fetch by key 2,654 8.0 1.8
index scans kdiixs1 21,363 64.7 14.1
leaf node 90-10 splits 1 0.0 0.0
leaf node splits 22 0.1 0.0
lob reads 0 0.0 0.0
logons cumulative 8 0.0 0.0
max cf enq hold time 10 0.0 0.0
messages received 7,384 22.4 4.9
messages sent 7,384 22.4 4.9
min active SCN optimization appli 3 0.0 0.0
no work - consistent read gets 38,059,326 115,331.3 25,039.0
non-idle wait count 1,539,791 4,666.0 1,013.0
non-idle wait time 288,320 873.7 189.7
opened cursors cumulative 41,495 125.7 27.3
parse count (failures) 1 0.0 0.0
parse count (hard) 159 0.5 0.1
parse count (total) 699 2.1 0.5
parse time cpu 20 0.1 0.0
parse time elapsed 510 1.6 0.3
physical read IO requests 1,590,597 4,820.0 1,046.5
physical read bytes 310,525,968,384 940,987,783.0 ############
physical read total IO requests 1,591,135 4,821.6 1,046.8
Instance Activity Stats DB/Inst: XE/XE Snaps: 15-16
Statistic Total per Second per Trans
--------------------------------- ------------------ -------------- ------------
physical read total bytes 310,536,718,336 941,020,358.6 ############
physical read total multi block r 594,348 1,801.1 391.0
physical reads 37,906,002 114,866.7 24,938.2
physical reads cache 1,021,227 3,094.6 671.9
physical reads cache prefetch 163,100 494.2 107.3
physical reads direct 36,884,775 111,772.1 24,266.3
physical reads direct temporary t 0 0.0 0.0
physical reads prefetch warmup 23,560 71.4 15.5
physical write IO requests 84,896 257.3 55.9
physical write bytes 765,083,648 2,318,435.3 503,344.5
physical write total IO requests 86,607 262.5 57.0
physical write total bytes 851,487,744 2,580,265.9 560,189.3
physical write total multi block 61 0.2 0.0
physical writes 93,394 283.0 61.4
physical writes direct 5 0.0 0.0
physical writes from cache 93,389 283.0 61.4
physical writes non checkpoint 92,610 280.6 60.9
pinned buffers inspected 17 0.1 0.0
prefetch warmup blocks aged out b 29,783 90.3 19.6
prefetched blocks aged out before 4,020 12.2 2.6
process last non-idle time 330 1.0 0.2
recursive calls 50,669 153.5 33.3
recursive cpu usage 16,242 49.2 10.7
redo blocks checksummed by FG (ex 84,989 257.5 55.9
redo blocks written 164,192 497.6 108.0
redo entries 81,981 248.4 53.9
redo size 81,429,948 246,757.4 53,572.3
redo synch long waits 1 0.0 0.0
redo synch time 1 0.0 0.0
redo synch time (usec) 6,243 18.9 4.1
redo synch writes 11 0.0 0.0
redo wastage 366,888 1,111.8 241.4
redo write time 446 1.4 0.3
redo writes 1,557 4.7 1.0
rollback changes - undo records a 0 0.0 0.0
rollbacks only - consistent read 0 0.0 0.0
rows fetched via callback 135 0.4 0.1
scheduler wait time 9,266 28.1 6.1
session connect time 330 1.0 0.2
session cursor cache hits 41,235 125.0 27.1
session logical reads 38,249,156 115,906.5 25,163.9
session uga memory max 18,891,112 57,245.8 12,428.4
shared hash latch upgrades - no w 216 0.7 0.1
shared hash latch upgrades - wait 2 0.0 0.0
sorts (memory) 678 2.1 0.5
sorts (rows) 14,485 43.9 9.5
sql area evicted 0 0.0 0.0
sql area purged 1 0.0 0.0
summed dirty queue length 412,521 1,250.1 271.4
switch current to new buffer 0 0.0 0.0
table fetch by rowid 1,152,248 3,491.7 758.1
table fetch continued row 0 0.0 0.0
table scan blocks gotten 36,884,469 111,771.1 24,266.1
table scan rows gotten 36,907,887 111,842.1 24,281.5
table scans (cache partitions) 8 0.0 0.0
table scans (direct read) 18,009 54.6 11.9
Instance Activity Stats DB/Inst: XE/XE Snaps: 15-16
Statistic Total per Second per Trans
--------------------------------- ------------------ -------------- ------------
table scans (long tables) 18,012 54.6 11.9
table scans (short tables) 54 0.2 0.0
total cf enq hold time 130 0.4 0.1
total number of cf enq holders 4 0.0 0.0
total number of times SMON posted 0 0.0 0.0
undo change vector size 35,101,488 106,368.2 23,093.1
user I/O wait time 278,099 842.7 183.0
user calls 175 0.5 0.1
user commits 1,520 4.6 1.0
workarea executions - optimal 285 0.9 0.2
write clones created in foregroun 27 0.1 0.0
-------------------------------------------------------------
Instance Activity Stats DB/Inst: XE/XE Snaps: 15-16
-> Statistics with absolute values (should not be diffed)
Statistic Begin Value End Value
--------------------------------- --------------- ---------------
logons current 31 23
opened cursors current 60 31
session cursor cache count 790 932
-------------------------------------------------------------
Instance Activity Stats DB/Inst: XE/XE Snaps: 15-16
-> Statistics identified by '(derived)' come from sources other than SYSSTAT
Statistic Total per Hour
--------------------------------- ------------------ ---------
log switches (derived) 2 21.82
-------------------------------------------------------------
OS Statistics DB/Inst: XE/XE Snaps: 15-16
-> ordered by statistic type (CPU use, Virtual Memory, Hardware Config), Name
Statistic Total
------------------------- ----------------------
BUSY_TIME 17,485
IDLE_TIME 109,108
IOWAIT_TIME 77,371
SYS_TIME 11,009
USER_TIME 5,469
RSRC_MGR_CPU_WAIT_TIME 8,982
VM_IN_BYTES 622,896,820,224
VM_OUT_BYTES 5,007,475,712
PHYSICAL_MEMORY_BYTES 8,191,578,112
NUM_CPUS 4
NUM_CPU_CORES 2
NUM_CPU_SOCKETS 1
GLOBAL_RECEIVE_SIZE_MAX 212,992
GLOBAL_SEND_SIZE_MAX 212,992
TCP_RECEIVE_SIZE_DEFAULT 87,380
TCP_RECEIVE_SIZE_MAX 6,291,456
TCP_RECEIVE_SIZE_MIN 4,096
TCP_SEND_SIZE_DEFAULT 16,384
TCP_SEND_SIZE_MAX 4,194,304
TCP_SEND_SIZE_MIN 4,096
-------------------------------------------------------------
OS Statistics - detail DB/Inst: XE/XE Snaps: 15-16
Snap Snapshot
Id Day Time Load %Busy %User %System %WIO %WCPU
------ --------------- ------ ------ ------ ------- ------ ------
15 Fri 12 20:40:55 .1
16 Fri 12 20:46:25 3.9 13.8 4.3 8.7 61.1
-------------------------------------------------------------
IO Stat by Function - summary DB/Inst: XE/XE Snaps: 15-16
->Data Volume values suffixed with M,G,T,P are in multiples of 1024,
other values suffixed with K,M,G,T,P are in multiples of 1000
->ordered by Data Volume (Read+Write) desc
---------- Read --------- --------- Write -------- --- Wait ----
Data Requests Data Data Requests Data Avg
Function Volume /sec Vol/sec Volume /sec Vol/sec Count Tm(ms)
--------------- ------ -------- -------- ------ -------- -------- ------ ------
Direct Reads 281G 1801.5 873.4M .0 0.0
Buffer Cache Re 8022M 3020.7 24.3M 859K 0.0
LGWR 1M .1 .0M 81M 4.9 .2M 1627 0.0
Others 7M 1.4 .0M 1M .3 .0M 584 0.0
-------------------------------------------------------------
IO Stat by Function - detail DB/Inst: XE/XE Snaps: 15-16
->ordered by Data Volume (Read+Write) desc
----------- Read ---------- ----------- Write ---------
Small Large Small Large Small Large Small Large
Read Read Data Data Write Write Data Data
Function Reqs Reqs Read Read Reqs Reqs Writn Writn
------------------ ------ ------ ------ ------ ------ ------ ------ ------
Direct Reads 5 594K 281G 1
Buffer Cache Reads 997K 7 8019M 3M
LGWR 34 1M 1594 13 79M 2M
Others 469 7M 115 1M
-------------------------------------------------------------
Tablespace IO Stats DB/Inst: XE/XE Snaps: 15-16
->ordered by IOs (Reads + Writes) desc
Tablespace
------------------------------
Av Av Av Av Buffer Av Buf
Reads Reads/s Rd(ms) Blks/Rd Writes Writes/s Waits Wt(ms)
-------------- ------- ------ ------- ------------ -------- ---------- ------
USERS
1,588,987 4,815 1.1 23.9 84,176 255 0 0.0
SYSTEM
1,755 5 0.2 1.1 3 0 17 0.0
UNDOTBS1
38 0 1.8 1.0 594 2 0 0.0
STATSPACK
272 1 4.5 2.5 120 0 0 0.0
SYSAUX
9 0 1.1 2.9 6 0 0 0.0
-------------------------------------------------------------
File IO Stats DB/Inst: XE/XE Snaps: 15-16
->Mx Rd Bkt: Max bucket time for single block read
->ordered by Tablespace, File
Tablespace Filename
------------------------ ----------------------------------------------------
Av Mx Av
Av Rd Rd Av Av Buffer BufWt
Reads Reads/s (ms) Bkt Blks/Rd Writes Writes/s Waits (ms)
-------------- ------- ----- --- ------- ------------ -------- ---------- ------
STATSPACK /mnt/myrbd/XE/statspack.dbf
272 1 4.5 32 2.5 120 0 0
SYSAUX /mnt/myrbd/XE/sysaux.dbf
9 0 1.1 4 2.9 6 0 0
SYSTEM /mnt/myrbd/XE/system.dbf
1,755 5 0.2 16 1.1 3 0 17 0.0
UNDOTBS1 /mnt/myrbd/XE/undotbs1.dbf
38 0 1.8 8 1.0 594 2 0
USERS /mnt/myrbd/XE/users.dbf
1,588,987 4,815 1.1 64 23.9 84,176 255 0
-------------------------------------------------------------
File Read Histogram Stats DB/Inst: XE/XE Snaps: 15-16
->Number of single block reads in each time range
->Tempfiles are not included
->ordered by Tablespace, File
Tablespace Filename
------------------------ ----------------------------------------------------
0 - 2 ms 2 - 4 ms 4 - 8 ms 8 - 16 ms 16 - 32 ms 32+ ms
------------ ------------ ------------ ------------ ------------ ------------
SYSAUX /mnt/myrbd/XE/sysaux.dbf
3 2 0 0 0 0
SYSTEM /mnt/myrbd/XE/system.dbf
1,686 24 15 8 0 0
UNDOTBS1 /mnt/myrbd/XE/undotbs1.dbf
19 17 1 0 0 0
STATSPACK /mnt/myrbd/XE/statspack.dbf
120 50 28 28 14 0
USERS /mnt/myrbd/XE/users.dbf
684,224 236,334 55,764 14,084 158 12
-------------------------------------------------------------
Instance Recovery Stats DB/Inst: XE/XE Snaps: 15-16
-> B: Begin snapshot, E: End snapshot
Targt Estd Log File Log Ckpt Log Ckpt
MTTR MTTR Recovery Actual Target Size Timeout Interval
(s) (s) Estd IOs Redo Blks Redo Blks Redo Blks Redo Blks Redo Blks
- ----- ----- ---------- --------- --------- ---------- --------- ------------
B 0 0 1734 3658 82944 82944
E 0 0 6148 82916 82944 82944
-------------------------------------------------------------
Memory Target Advice DB/Inst: XE/XE Snaps: 15-16
-> Advice Reset: if this is null, the data shown has been diffed between
the Begin and End snapshots. If this is 'Y', the advisor has been
reset during this interval due to memory resize operations, and
the data shown is since the reset operation.
Memory Size Est. Advice
Memory Size (M) Factor DB time (s) Reset
--------------- ----------- ------------ ------
512 .5 3,015 Y
768 .8 3,015 Y
1,024 1.0 3,015 Y
1,280 1.3 3,015 Y
1,536 1.5 3,015 Y
1,792 1.8 3,015 Y
2,048 2.0 3,015 Y
-------------------------------------------------------------
Memory Dynamic Components DB/Inst: XE/XE Snaps: 15-16
-> Op - memory resize Operation
-> Cache: D: Default, K: Keep, R: Recycle
-> Mode: DEF: DEFerred mode, IMM: IMMediate mode
Begin Snap End Snap Op Last Op
Cache Size (M) Size (M) Count Type/Mode Last Op Time
---------------------- ---------- -------- ------- ---------- ---------------
D:buffer cache 424 0 INITIA/
PGA Target 412 0 STATIC
SGA Target 612 0 STATIC
java pool 4 0 STATIC
large pool 4 0 STATIC
shared pool 168 0 STATIC
-------------------------------------------------------------
Buffer Pool Statistics DB/Inst: XE/XE Snaps: 15-16
-> Standard block size Pools D: default, K: keep, R: recycle
-> Default Pools for other block sizes: 2k, 4k, 8k, 16k, 32k
-> Buffers: the number of buffers. Units of K, M, G are divided by 1000
Free Writ Buffer
Pool Buffer Physical Physical Buffer Comp Busy
P Buffers Hit% Gets Reads Writes Waits Wait Waits
--- ------- ---- -------------- ------------ ----------- ------- ---- ----------
D 52K 25 1,365,585 1,024,423 93,391 0 0 17
-------------------------------------------------------------
Buffer wait Statistics DB/Inst: XE/XE Snaps: 15-16
-> ordered by wait time desc, waits desc
Class Waits Total Wait Time (s) Avg Time (ms)
---------------------- ----------- ------------------- -------------
data block 16 0 0
segment header 1 0 0
-------------------------------------------------------------
PGA Aggr Target Stats DB/Inst: XE/XE Snaps: 15-16
-> B: Begin snap E: End snap (rows identified with B or E contain data
which is absolute i.e. not diffed over the interval)
-> PGA cache hit % - percentage of W/A (WorkArea) data processed only in-memory
-> Auto PGA Target - actual workarea memory target
-> W/A PGA Used - amount of memory used for all WorkAreas (manual + auto)
-> %PGA W/A Mem - percentage of PGA memory allocated to WorkAreas
-> %Auto W/A Mem - percentage of WorkArea memory controlled by Auto Mem Mgmt
-> %Man W/A Mem - percentage of WorkArea memory under Manual control
PGA Cache Hit % W/A MB Processed Extra W/A MB Read/Written
--------------- ---------------- -------------------------
100.0 21 0
PGA Aggr Target Histogram DB/Inst: XE/XE Snaps: 15-16
-> Optimal Executions are purely in-memory operations
Low High
Optimal Optimal Total Execs Optimal Execs 1-Pass Execs M-Pass Execs
------- ------- -------------- ------------- ------------ ------------
2K 4K 182 182 0 0
64K 128K 3 3 0 0
512K 1024K 14 14 0 0
4M 8M 2 2 0 0
-------------------------------------------------------------
PGA Memory Advisory DB/Inst: XE/XE End Snap: 16
-> When using Auto Memory Mgmt, minimally choose a pga_aggregate_target value
where Estd PGA Overalloc Count is 0
Estd Extra Estd
PGA Aggr W/A MB Estd Time PGA Estd PGA
Target Size W/A MB Read/Written to Process Cache Overalloc
Est (MB) Factr Processed to Disk Bytes (s) Hit % Count
---------- ------ -------------- -------------- ---------- ------ ----------
52 0.1 47 0 0.0 100.0 1
103 0.3 47 0 0.0 100.0 0
206 0.5 47 0 0.0 100.0 0
309 0.8 47 0 0.0 100.0 0
412 1.0 47 0 0.0 100.0 0
494 1.2 47 0 0.0 100.0 0
577 1.4 47 0 0.0 100.0 0
659 1.6 47 0 0.0 100.0 0
742 1.8 47 0 0.0 100.0 0
824 2.0 47 0 0.0 100.0 0
1,236 3.0 47 0 0.0 100.0 0
1,648 4.0 47 0 0.0 100.0 0
2,472 6.0 47 0 0.0 100.0 0
3,296 8.0 47 0 0.0 100.0 0
-------------------------------------------------------------
Process Memory Summary Stats DB/Inst: XE/XE Snaps: 15-16
-> B: Begin snap E: End snap
-> All rows below contain absolute values (i.e. not diffed over the interval)
-> Max Alloc is Maximum PGA Allocation size at snapshot time
Hist Max Alloc is the Historical Max Allocation for still-connected processes
-> Num Procs or Allocs: For Begin/End snapshot lines, it is the number of
processes. For Category lines, it is the number of allocations
-> ordered by Begin/End snapshot, Alloc (MB) desc
Hist Num
Avg Std Dev Max Max Procs
Alloc Used Freeabl Alloc Alloc Alloc Alloc or
Category (MB) (MB) (MB) (MB) (MB) (MB) (MB) Allocs
- -------- --------- --------- -------- -------- ------- ------- ------ ------
B -------- 106.7 57.5 12.0 3.0 2.8 12 12 36
Other 90.4 2.5 2.4 12 12 36
Freeable 12.0 .0 2.0 2.6 7 6
SQL 2.6 1.6 .1 .3 1 7 17
PL/SQL 1.7 1.5 .1 .1 0 0 31
E -------- 59.7 39.6 11.8 2.1 2.7 12 12 28
Other 46.8 1.7 2.3 12 12 28
Freeable 11.8 .0 1.7 2.2 6 7
SQL .6 .2 .1 .1 0 6 9
PL/SQL .5 .5 .0 .1 0 0 23
-------------------------------------------------------------
Top Process Memory (by component) DB/Inst: XE/XE Snaps: 15-16
-> ordered by Begin/End snapshot, Alloc (MB) desc
Alloc Used Freeabl Max Hist Max
PId Category (MB) (MB) (MB) Alloc (MB) Alloc (MB)
- ------ ------------- ------- ------- -------- ---------- ----------
B 11 LGWR -------- 11.7 10.8 .1 11.7 11.7
Other 11.6 11.6 11.6
Freeable .1 .0 .1
PL/SQL .0 .0 .0 .0
32 TNS V1-V3 --- 9.6 1.9 7.0 9.6 9.6
Freeable 7.0 .0 7.0
Other 2.3 2.3 2.3
PL/SQL .2 .2 .2 .2
SQL .1 .0 .1 6.7
10 DBW0 -------- 7.3 6.5 .6 7.3 7.3
Other 6.7 6.7 6.7
Freeable .6 .0 .6
PL/SQL .0 .0 .0 .0
27 ------------ 5.4 2.3 .0 5.4 5.4
Other 5.2 5.2 5.2
PL/SQL .1 .1 .1 .1
SQL .1 .0 .1 1.8
30 ------------ 5.4 2.5 .0 5.4 5.4
Other 5.2 5.2 5.2
PL/SQL .1 .1 .1 .1
SQL .1 .0 .1 1.8
33 ------------ 5.4 1.3 .0 5.4 5.4
Other 5.2 5.2 5.2
PL/SQL .1 .1 .1 .1
SQL .1 .1 .1 1.8
36 ------------ 5.4 2.4 .0 5.4 5.4
Other 5.2 5.2 5.2
PL/SQL .1 .1 .1 .1
SQL .1 .0 .1 1.8
31 ------------ 4.9 1.4 .0 4.9 4.9
Other 4.7 4.7 4.7
PL/SQL .1 .1 .1 .1
SQL .1 .1 .1 1.8
34 ------------ 4.9 2.4 .0 4.9 4.9
Other 4.7 4.7 4.7
PL/SQL .1 .1 .1 .1
SQL .1 .0 .1 1.8
35 ------------ 4.9 1.3 .0 4.9 4.9
Other 4.7 4.7 4.7
PL/SQL .1 .1 .1 .1
SQL .1 .0 .1 1.8
37 ------------ 4.9 2.5 .0 4.9 4.9
Other 3.6 3.6 3.6
SQL 1.2 1.1 1.2 1.8
PL/SQL .1 .1 .1 .1
28 ------------ 4.8 1.3 .0 4.8 4.8
Other 4.6 4.6 4.6
SQL .1 .0 .1 1.8
PL/SQL .1 .1 .1 .1
15 MMON -------- 4.5 2.0 2.3 4.5 4.5
Freeable 2.3 .0 2.3
Other 2.0 2.0 2.0
SQL .1 .0 .1 1.1
Top Process Memory (by component) DB/Inst: XE/XE Snaps: 15-16
-> ordered by Begin/End snapshot, Alloc (MB) desc
Alloc Used Freeabl Max Hist Max
PId Category (MB) (MB) (MB) Alloc (MB) Alloc (MB)
- ------ ------------- ------- ------- -------- ---------- ----------
B 15 PL/SQL .1 .1 .1 .1
29 ------------ 3.7 1.3 .0 3.7 3.7
Other 3.5 3.5 3.5
PL/SQL .1 .1 .1 .1
SQL .1 .0 .1 1.8
22 TNS V1-V3 --- 2.9 1.6 .8 2.9 6.8
Other 2.0 2.0 3.6
Freeable .8 .0 .8
SQL .1 .0 .1 2.5
PL/SQL .0 .0 .0 .0
13 SMON -------- 2.6 .9 1.3 2.6 2.6
Freeable 1.3 .0 1.3
Other 1.2 1.2 1.2
SQL .1 .0 .1 1.4
PL/SQL .0 .0 .0 .0
25 Q000 -------- 1.6 1.1 .0 1.6 1.6
Other 1.3 1.3 1.3
PL/SQL .2 .2 .2 .2
SQL .0 .0 .0 .2
12 CKPT -------- 1.5 .8 .0 1.5 1.5
Other 1.5 1.5 1.5
PL/SQL .0 .0 .0 .0
17 D000 -------- 1.3 1.2 .0 1.3 1.3
Other 1.3 1.3 1.3
8 DIA0 -------- 1.2 1.0 .0 1.2 1.2
Other 1.2 1.2 1.2
PL/SQL .0 .0 .0 .0
E 11 LGWR -------- 11.7 10.8 .2 11.7 11.7
Other 11.5 11.5 11.5
Freeable .2 .0 .2
PL/SQL .0 .0 .0 .0
28 TNS V1-V3 --- 8.1 1.4 6.3 8.1 8.1
Freeable 6.3 .0 6.3
Other 1.5 1.5 1.5
PL/SQL .2 .2 .2 .2
SQL .1 .1 .1 6.2
10 DBW0 -------- 7.3 6.5 .6 7.3 7.3
Other 6.7 6.7 6.7
Freeable .6 .0 .6
PL/SQL .0 .0 .0 .0
13 SMON -------- 4.8 1.0 1.3 4.8 4.8
Other 3.3 3.3 3.3
Freeable 1.3 .0 1.3
SQL .1 .1 .1 2.1
PL/SQL .0 .0 .0 .0
15 MMON -------- 4.5 2.0 2.3 4.5 4.5
Freeable 2.3 .0 2.3
Other 2.0 2.0 2.0
SQL .1 .0 .1 1.1
PL/SQL .1 .1 .1 .1
22 TNS V1-V3 --- 2.9 1.6 .8 2.9 6.8
Other 2.0 2.0 3.6
Freeable .8 .0 .8
Top Process Memory (by component) DB/Inst: XE/XE Snaps: 15-16
-> ordered by Begin/End snapshot, Alloc (MB) desc
Alloc Used Freeabl Max Hist Max
PId Category (MB) (MB) (MB) Alloc (MB) Alloc (MB)
- ------ ------------- ------- ------- -------- ---------- ----------
E 22 SQL .1 .0 .1 2.5
PL/SQL .0 .0 .0 .0
25 Q000 -------- 1.6 1.1 .3 1.6 1.6
Other 1.0 1.0 1.0
Freeable .3 .0 .3
PL/SQL .2 .2 .2 .2
SQL .0 .0 .0 .2
12 CKPT -------- 1.5 .8 .0 1.5 1.5
Other 1.5 1.5 1.5
PL/SQL .0 .0 .0 .0
17 D000 -------- 1.3 1.2 .0 1.3 1.3
Other 1.3 1.3 1.3
8 DIA0 -------- 1.2 1.0 .0 1.2 1.2
Other 1.2 1.2 1.2
PL/SQL .0 .0 .0 .0
14 RECO -------- 1.1 .8 .0 1.1 1.1
Other 1.0 1.0 1.0
SQL .0 .0 .0 .1
PL/SQL .0 .0 .0 .0
7 DBRM -------- 1.0 .8 .0 1.0 1.0
Other 1.0 1.0 1.0
SQL .0 .0 .0 .1
PL/SQL .0 .0 .0 .0
-------------------------------------------------------------
Enqueue activity DB/Inst: XE/XE Snaps: 15-16
-> only enqueues with waits are shown
-> Enqueue stats gathered prior to 10g should not be compared with 10g data
-> ordered by Wait Time desc, Waits desc
Enqueue Type (Request Reason)
------------------------------------------------------------------------------
Requests Succ Gets Failed Gets Waits Wt Time (s) Av Wt Time(ms)
------------ ------------ ----------- ----------- ------------ --------------
KO-Multiple Object Checkpoint (fast object checkpoint)
36 36 0 4 0 .00
-------------------------------------------------------------
Latch Activity DB/Inst: XE/XE Snaps: 15-16
->"Get Requests", "Pct Get Miss" and "Avg Slps/Miss" are statistics for
willing-to-wait latch get requests
->"NoWait Requests", "Pct NoWait Miss" are for no-wait latch get requests
->"Pct Misses" for both should be very close to 0.0
Pct Avg Wait Pct
Get Get Slps Time NoWait NoWait
Latch Requests Miss /Miss (s) Requests Miss
------------------------ -------------- ------ ------ ------ ------------ ------
AQ deq hash table latch 1 0.0 0 0
ASM db client latch 225 0.0 0 0
ASM map operation hash t 1 0.0 0 0
ASM network state latch 5 0.0 0 0
Change Notification Hash 110 0.0 0 0
Consistent RBA 1,558 0.0 0 0
DML lock allocation 3,170 0.0 0 0
Event Group Locks 9 0.0 0 0
FOB s.o list latch 65 0.0 0 0
File State Object Pool P 1 0.0 0 0
I/O Staticstics latch 1 0.0 0 0
IPC stats buffer allocat 1 0.0 0 0
In memory undo latch 352,583 0.0 0.7 0 1,513 0.0
JS Sh mem access 1 0.0 0 0
JS queue access latch 1 0.0 0 0
JS slv state obj latch 1 0.0 0 0
KFC FX Hash Latch 1 0.0 0 0
KFC Hash Latch 1 0.0 0 0
KFCL LE Freelist 1 0.0 0 0
KGNFS-NFS:SHM structure 1 0.0 0 0
KGNFS-NFS:SVR LIST 1 0.0 0 0
KJC message pool free li 1 0.0 0 0
KJCT flow control latch 1 0.0 0 0
KMG MMAN ready and start 109 0.0 0 0
KTF sga latch 3 0.0 0 103 0.0
KWQP Prop Status 1 0.0 0 0
Locator state objects po 1 0.0 0 0
Lsod array latch 1 0.0 0 0
MQL Tracking Latch 0 0 8 12.5
Memory Management Latch 1 0.0 0 109 0.0
Memory Queue 1 0.0 0 0
Memory Queue Message Sub 1 0.0 0 0
Memory Queue Message Sub 1 0.0 0 0
Memory Queue Message Sub 1 0.0 0 0
Memory Queue Message Sub 1 0.0 0 0
Memory Queue Subscriber 1 0.0 0 0
MinActiveScn Latch 4 0.0 0 0
Mutex 1 0.0 0 0
Mutex Stats 1 0.0 0 0
OS process 61 0.0 0 0
OS process allocation 686 0.0 0 0
OS process: request allo 24 0.0 0 0
PL/SQL warning settings 50 0.0 0 0
PX hash array latch 1 0.0 0 0
QMT 1 0.0 0 0
SGA IO buffer pool latch 8 0.0 0 8 0.0
SGA blob parent 1 0.0 0 0
SGA bucket locks 1 0.0 0 0
SGA heap locks 1 0.0 0 0
SGA pool locks 1 0.0 0 0
Latch Activity DB/Inst: XE/XE Snaps: 15-16
->"Get Requests", "Pct Get Miss" and "Avg Slps/Miss" are statistics for
willing-to-wait latch get requests
->"NoWait Requests", "Pct NoWait Miss" are for no-wait latch get requests
->"Pct Misses" for both should be very close to 0.0
Pct Avg Wait Pct
Get Get Slps Time NoWait NoWait
Latch Requests Miss /Miss (s) Requests Miss
------------------------ -------------- ------ ------ ------ ------------ ------
SQL memory manager latch 12 0.0 0 109 0.0
SQL memory manager worka 7,441 0.0 0 0
Shared B-Tree 16 0.0 0 0
Streams Generic 1 0.0 0 0
Testing 1 0.0 0 0
Token Manager 1 0.0 0 0
WCR: sync 1 0.0 0 0
Write State Object Pool 1 0.0 0 0
XDB NFS Security Latch 1 0.0 0 0
XDB unused session pool 1 0.0 0 0
XDB used session pool 1 0.0 0 0
active checkpoint queue 5,950 0.0 0 0
active service list 140 0.0 0 179 0.0
buffer pool 1 0.0 0 0
business card 1 0.0 0 0
cache buffer handles 101 0.0 0 0
cache buffers chains 4,532,097 0.0 0.0 0 1,310,456 0.0
cache buffers lru chain 108,849 0.1 0.0 0 1,236,134 0.3
cache table scan latch 0 0 130 0.0
call allocation 381 0.3 1.0 0 0
cas latch 1 0.0 0 0
change notification clie 1 0.0 0 0
channel handle pool latc 39 0.0 0 0
channel operations paren 1,846 0.0 0 0
checkpoint queue latch 151,241 0.0 0.0 0 96,224 0.0
client/application info 56 0.0 0 0
compile environment latc 8 0.0 0 0
cp cmon/server latch 1 0.0 0 0
cp pool latch 1 0.0 0 0
cp server hash latch 1 0.0 0 0
cp sga latch 5 0.0 0 0
cvmap freelist lock 1 0.0 0 0
deferred cleanup latch 5 0.0 0 0
dml lock allocation 5 0.0 0 0
done queue latch 1 0.0 0 0
dummy allocation 25 0.0 0 0
enqueue hash chains 6,905 0.0 0 0
enqueues 690 0.0 0 0
fifth spare latch 1 0.0 0 0
flashback copy 1 0.0 0 0
fourth Audit Vault latch 1 0.0 0 0
gc element 1 0.0 0 0
gcs commit scn state 1 0.0 0 0
gcs partitioned table ha 1 0.0 0 0
gcs pcm hashed value buc 1 0.0 0 0
gcs resource freelist 1 0.0 0 0
gcs resource hash 1 0.0 0 0
gcs resource scan list 1 0.0 0 0
gcs shadows freelist 1 0.0 0 0
ges domain table 1 0.0 0 0
Latch Activity DB/Inst: XE/XE Snaps: 15-16
->"Get Requests", "Pct Get Miss" and "Avg Slps/Miss" are statistics for
willing-to-wait latch get requests
->"NoWait Requests", "Pct NoWait Miss" are for no-wait latch get requests
->"Pct Misses" for both should be very close to 0.0
Pct Avg Wait Pct
Get Get Slps Time NoWait NoWait
Latch Requests Miss /Miss (s) Requests Miss
------------------------ -------------- ------ ------ ------ ------------ ------
ges enqueue table freeli 1 0.0 0 0
ges group table 1 0.0 0 0
ges process hash list 1 0.0 0 0
ges process parent latch 1 0.0 0 0
ges resource hash list 1 0.0 0 0
ges resource scan list 1 0.0 0 0
ges resource table freel 1 0.0 0 0
ges value block free lis 1 0.0 0 0
global KZLD latch for me 3 0.0 0 0
global tx hash mapping 1 0.0 0 0
granule operation 1 0.0 0 0
hash table column usage 0 0 6,764 0.0
hash table modification 27 0.0 0 0
heartbeat check 1 0.0 0 0
intra txn parallel recov 1 0.0 0 0
io pool granule metadata 1 0.0 0 0
job workq parent latch 1 0.0 0 0
k2q lock allocation 1 0.0 0 0
kcbtsemkid latch 2 0.0 0 0
kdlx hb parent latch 1 0.0 0 0
kgb parent 1 0.0 0 0
kgnfs mount latch 1 0.0 0 0
ksfv messages 1 0.0 0 0
ksim group membership ca 1 0.0 0 0
kss move lock 3 0.0 0 0
ksuosstats global area 17 0.0 0 0
ksv allocation latch 8 0.0 0 0
ksv class latch 3 0.0 0 0
ksv instance latch 1 0.0 0 0
ksv msg queue latch 1 0.0 0 0
ksz_so allocation latch 24 0.0 0 0
ktm global data 4 0.0 0 0
kwqbsn:qsga 15 0.0 0 0
lgwr LWN SCN 1,564 0.0 0 0
list of block allocation 6,104 0.0 0 0
loader state object free 36,027 0.0 0.0 0 0
lob segment dispenser la 1 0.0 0 0
lob segment hash table l 3 0.0 0 0
lob segment query latch 1 0.0 0 0
lock DBA buffer during m 1 0.0 0 0
logical standby cache 1 0.0 0 0
logminer context allocat 1 0.0 0 0
logminer work area 1 0.0 0 0
longop free list parent 1 0.0 0 0
mapped buffers lru chain 1 0.0 0 0
message pool operations 10 0.0 0 0
messages 19,393 0.0 0 0
mostly latch-free SCN 1,595 0.2 0.0 0 0
msg queue latch 1 0.0 0 0
multiblock read objects 23,730 0.0 0.0 0 0
Latch Activity DB/Inst: XE/XE Snaps: 15-16
->"Get Requests", "Pct Get Miss" and "Avg Slps/Miss" are statistics for
willing-to-wait latch get requests
->"NoWait Requests", "Pct NoWait Miss" are for no-wait latch get requests
->"Pct Misses" for both should be very close to 0.0
Pct Avg Wait Pct
Get Get Slps Time NoWait NoWait
Latch Requests Miss /Miss (s) Requests Miss
------------------------ -------------- ------ ------ ------ ------------ ------
name-service namespace b 1 0.0 0 0
ncodef allocation latch 5 0.0 0 0
object queue header heap 24,073 0.0 0 821 0.0
object queue header oper 2,468,331 0.0 0.0 0 0
object stats modificatio 317 0.0 0 0
parallel query alloc buf 45 0.0 0 0
parallel query stats 1 0.0 0 0
parameter list 20 0.0 0 0
parameter table manageme 24 0.0 0 0
peshm 1 0.0 0 0
pesom_free_list 1 0.0 0 0
pesom_hash_node 1 0.0 0 0
post/wait queue 3 0.0 0 1 0.0
process allocation 26 0.0 0 8 0.0
process group creation 24 0.0 0 0
process queue 1 0.0 0 0
process queue reference 1 0.0 0 0
qmn task queue latch 48 0.0 0 0
query server freelists 1 0.0 0 0
queued dump request 1 0.0 0 0
queuing load statistics 1 0.0 0 0
recovery domain hash lis 1 0.0 0 0
redo allocation 88,298 0.1 0.1 0 0
redo copy 1 0.0 0 81,961 0.0
redo writing 10,820 0.0 0.0 0 0
resmgr group change latc 13 0.0 0 0
resmgr:active threads 25 0.0 0 117 0.0
resmgr:actses change gro 9 0.0 0 0
resmgr:actses change sta 4 0.0 0 0
resmgr:free threads list 24 0.0 0 0
resmgr:plan CPU method 1 0.0 0 0
resmgr:resource group CP 135,620 0.4 0.0 0 0
resmgr:schema config 1 0.0 0 4 0.0
resmgr:session queuing 1 0.0 0 0
rm cas latch 1 0.0 0 0
row cache objects 24,116 0.0 0.0 0 0
rules engine rule set st 100 0.0 0 0
second Audit Vault latch 1 0.0 0 0
second spare latch 1 0.0 0 0
sequence cache 12 0.0 0 0
session allocation 1,011 0.0 0 977 0.0
session idle bit 1,331 0.0 0 0
session queue latch 1 0.0 0 0
session state list latch 24 0.0 0 0
session switching 86 0.0 0 0
session timer 109 0.0 0 0
shared pool 24,788 0.0 0.1 0 0
shared pool sim alloc 16 0.0 0 0
shared pool simulator 968 0.0 0 0
sim partition latch 1 0.0 0 0
Latch Activity DB/Inst: XE/XE Snaps: 15-16
->"Get Requests", "Pct Get Miss" and "Avg Slps/Miss" are statistics for
willing-to-wait latch get requests
->"NoWait Requests", "Pct NoWait Miss" are for no-wait latch get requests
->"Pct Misses" for both should be very close to 0.0
Pct Avg Wait Pct
Get Get Slps Time NoWait NoWait
Latch Requests Miss /Miss (s) Requests Miss
------------------------ -------------- ------ ------ ------ ------------ ------
simulator hash latch 1 0.0 0 0
simulator lru latch 1 0.0 0 0
sort extent pool 6 0.0 0 0
space background state o 2 0.0 0 0
space background task la 34 0.0 0 28 0.0
tablespace key chain 1 0.0 0 0
test excl. parent l0 1 0.0 0 0
test excl. parent2 l0 1 0.0 0 0
third spare latch 1 0.0 0 0
threshold alerts latch 6 0.0 0 0
trace latch 1 0.0 0 0
transaction allocation 18 0.0 0 0
undo global data 12,186 0.0 0 0
virtual circuit buffers 1 0.0 0 0
virtual circuit holder 1 0.0 0 0
virtual circuit queues 1 0.0 0 0
-------------------------------------------------------------
Latch Sleep breakdown DB/Inst: XE/XE Snaps: 15-16
-> ordered by misses desc
Get Spin
Latch Name Requests Misses Sleeps Gets
-------------------------- --------------- ------------ ----------- -----------
resmgr:resource group CPU 135,620 525 2 523
object queue header operat 2,468,331 481 4 477
cache buffers lru chain 108,849 111 1 110
In memory undo latch 352,583 101 70 31
redo allocation 88,298 66 4 62
shared pool 24,788 12 1 11
call allocation 381 1 1 0
-------------------------------------------------------------
Latch Miss Sources DB/Inst: XE/XE Snaps: 15-16
-> only latches with sleeps are shown
-> ordered by name, sleeps desc
NoWait Waiter
Latch Name Where Misses Sleeps Sleeps
------------------------ -------------------------- ------- ---------- --------
In memory undo latch ktiFlush: child 0 75 14
cache buffers lru chain kcbzgws 0 1 0
call allocation ksuxds 0 1 1
object queue header oper kcbo_unlink_q 0 5 1
object queue header oper kcbo_link_q 0 2 1
object queue header oper kcbo_switch_cq 0 2 5
redo allocation kcrfw_redo_gen: redo alloc 0 4 4
resmgr:resource group CP kgkprraddtorl 0 2 1
shared pool kghalo 0 1 1
-------------------------------------------------------------
Mutex Sleep DB/Inst: XE/XE Snaps: 15-16
-> ordered by Wait Time desc
Wait
Mutex Type Location Sleeps Time (s)
------------------ -------------------------------- -------------- ------------
Library Cache kglhdgn2 106 2 0.0
Library Cache kglget2 2 5 0.0
Library Cache kglpnal1 90 1 0.0
-------------------------------------------------------------
Dictionary Cache Stats DB/Inst: XE/XE Snaps: 15-16
->"Pct Misses" should be very low (< 2% in most cases)
->"Final Usage" is the number of cache entries being used in End Snapshot
Get Pct Scan Pct Mod Final
Cache Requests Miss Reqs Miss Reqs Usage
------------------------- ------------ ------ ------- ----- -------- ----------
dc_awr_control 6 0.0 0 0 1
dc_global_oids 56 1.8 0 0 27
dc_histogram_data 57 38.6 0 0 293
dc_histogram_defs 1,895 51.4 0 0 2,092
dc_object_grants 126 3.2 0 0 166
dc_objects 1,326 13.6 0 0 1,086
dc_profiles 2 0.0 0 0 1
dc_rollback_segments 65 0.0 0 0 22
dc_segments 496 1.4 0 0 322
dc_tablespaces 1,787 0.0 0 0 6
dc_users 2,501 0.0 0 0 57
global database name 225 0.0 0 0 1
-------------------------------------------------------------
Library Cache Activity DB/Inst: XE/XE Snaps: 15-16
->"Pct Misses" should be very low
Get Pct Pin Pct Invali-
Namespace Requests Miss Requests Miss Reloads dations
--------------- ------------ ------ -------------- ------ ---------- --------
ACCOUNT_STATUS 4 0.0 0 0 0
BODY 11 9.1 30 3.3 0 0
CLUSTER 6 0.0 6 0.0 0 0
DBLINK 8 0.0 0 0 0
EDITION 5 0.0 7 0.0 0 0
SCHEMA 383 0.0 0 0 0
SQL AREA 239 48.5 41,593 1.2 0 1
SQL AREA BUILD 174 88.5 0 0 0
SQL AREA STATS 170 100.0 170 100.0 0 0
TABLE/PROCEDURE 1,010 16.7 1,936 33.5 1 0
-------------------------------------------------------------
Rule Sets DB/Inst: XE/XE Snaps: 15-16
-> * indicates Rule Set activity (re)started between Begin/End snaps
-> Top 25 ordered by Evaluations desc
No-SQL SQL
Rule * Eval/sec Reloads/sec Eval % Eval %
----------------------------------- - ------------ ----------- ------ ------
SYS.ALERT_QUE_R 0 0 0 0
-------------------------------------------------------------
Shared Pool Advisory DB/Inst: XE/XE End Snap: 16
-> SP: Shared Pool Est LC: Estimated Library Cache Factr: Factor
-> Note there is often a 1:Many correlation between a single logical object
in the Library Cache, and the physical number of memory objects associated
with it. Therefore comparing the number of Lib Cache objects (e.g. in
v$librarycache), with the number of Lib Cache Memory Objects is invalid
Est LC Est LC Est LC Est LC
Shared SP Est LC Time Time Load Load Est LC
Pool Size Size Est LC Saved Saved Time Time Mem
Size (M) Factr (M) Mem Obj (s) Factr (s) Factr Obj Hits
---------- ----- -------- ------------ ------- ------ ------- ------ -----------
108 .6 5 505 4,130 1.0 13 1.0 8,718
128 .8 22 1,913 4,130 1.0 13 1.0 30,538
148 .9 27 2,274 4,130 1.0 13 1.0 30,569
168 1.0 27 2,274 4,130 1.0 13 1.0 30,569
188 1.1 27 2,274 4,130 1.0 13 1.0 30,569
208 1.2 27 2,274 4,130 1.0 13 1.0 30,569
228 1.4 27 2,274 4,130 1.0 13 1.0 30,569
248 1.5 27 2,274 4,130 1.0 13 1.0 30,569
268 1.6 27 2,274 4,130 1.0 13 1.0 30,569
288 1.7 27 2,274 4,130 1.0 13 1.0 30,569
308 1.8 27 2,274 4,130 1.0 13 1.0 30,569
328 2.0 27 2,274 4,130 1.0 13 1.0 30,569
348 2.1 27 2,274 4,130 1.0 13 1.0 30,569
-------------------------------------------------------------
SGA Target Advisory DB/Inst: XE/XE End Snap: 16
SGA Target SGA Size Est DB Est DB Est Physical
Size (M) Factor Time (s) Time Factor Reads
---------- -------- -------- ----------- --------------
306 .5 3,015 1.0
459 .8 3,015 1.0
612 1.0 3,015 1.0
765 1.3 3,015 1.0
918 1.5 3,015 1.0
1,071 1.8 3,015 1.0
1,224 2.0 3,015 1.0
-------------------------------------------------------------
SGA Memory Summary DB/Inst: XE/XE Snaps: 15-16
End Size (Bytes)
SGA regions Begin Size (Bytes) (if different)
------------------------------ -------------------- --------------------
Database Buffers 444,596,224
Fixed Size 2,233,344
Redo Buffers 5,541,888
Variable Size 616,565,760
-------------------- --------------------
sum 1,068,937,216
-------------------------------------------------------------
SGA breakdown difference DB/Inst: XE/XE Snaps: 15-16
-> Top 35 rows by size, ordered by Pool, Name (note rows with null values for
Pool column, or Names showing free memory are always shown)
-> Null value for Begin MB or End MB indicates the size of that Pool/Name was
insignificant, or zero in that snapshot
Pool Name Begin MB End MB % Diff
------ ------------------------------ -------------- -------------- --------
java p free memory 4.0 4.0 0.00
large PX msg pool 3.7 3.7 0.00
large free memory .3 .3 0.00
shared ASH buffers 8.0 8.0 0.00
shared FileOpenBlock 3.8 3.8 0.00
shared KCB Table Scan Buffer 3.8 3.8 0.00
shared KGLH0 9.8 13.2 35.15
shared KGLHD 2.2 2.5 15.69
shared KGLS 5.3 6.7 25.35
shared KGLSG 5.0 5.0 0.00
shared KSFD SGA I/O b 3.8 3.8 0.00
shared SQLA 7.8 11.5 47.74
shared db_block_hash_buckets 2.8 2.8 0.00
shared dbwriter coalesce buffer 3.8 3.8 0.00
shared dirty object counts array 2.0 2.0 0.00
shared event statistics per sess 2.1 2.1 0.00
shared free memory 52.0 42.8 -17.69
shared kglsim hash table bkts 4.0 4.0 0.00
shared ksunfy : SSO free list 2.0 2.0 0.00
shared obj stats allocation chun 2.5 2.5 0.00
shared private strands 2.3 2.3 0.00
shared row cache 7.2 7.2 0.00
shared write state object 2.2 2.2 0.00
buffer_cache 424.0 424.0 0.00
fixed_sga 2.1 2.1 0.00
log_buffer 5.3 5.3 0.00
-------------------------------------------------------------
SQL Memory Statistics DB/Inst: XE/XE Snaps: 15-16
Begin End % Diff
-------------- -------------- --------------
Avg Cursor Size (KB): 24.59 24.64 .23
Cursor to Parent ratio: 1.07 1.07 -.14
Total Cursors: 563 603 6.63
Total Parents: 524 562 6.76
-------------------------------------------------------------
init.ora Parameters DB/Inst: XE/XE Snaps: 15-16
End value
Parameter Name Begin value (if different)
----------------------------- --------------------------------- --------------
audit_file_dest /u01/app/oracle/admin/XE/adump
compatible 11.2.0.0.0
control_files /mnt/myrbd/XE/control.dbf
db_cache_advice READY
db_file_multiblock_read_count 64
db_keep_cache_size 0
db_name XE
db_recycle_cache_size 0
diagnostic_dest /u01/app/oracle
disk_asynch_io TRUE
dispatchers (PROTOCOL=TCP) (SERVICE=XEXDB)
filesystemio_options setall
job_queue_processes 4
memory_target 1073741824
open_cursors 300
processes 100
remote_login_passwordfile EXCLUSIVE
resource_limit TRUE
resource_manager_plan FORCE:
sessions 172
shared_servers 4
undo_management AUTO
undo_retention 90
undo_tablespace UNDOTBS1
-------------------------------------------------------------
End of Report ( /home/oracle/slob/SLOB/testreports/1613159711/1613159711.rpt )В обоих тестах было выставлено filesystemio_options='setall' т.е. база делала io в датафайлы в директ-моде.
Ну, по моему, вполне себе хорошо выправляет, такое кэширование, продуктивность тестовой бд. Для функционального тестирования - вполне. Плюс, ещё, можно и нужно: редо/ундо/темпы тестовой бд - вывести на локальные-честные дисковые устройства devdb-вм и оно - должно будет ещё пободрее работать с дисками и быть менее чувствительна к деградации качества сетевой связности между devdb-вм и ceph-ом.
Ну т.е., вот. Как угодно: в ceph-е создаются-ведутся образы исходных баз. И из ceph-а, они могут быть поданы, rbd-интерфейсом, на какую то удалённую виртуалку. Быстро поданы и не важно - какого размера образ бд, насколько удалена эта вм. Т.е. от самой этой вм - не требуется каких то значительных ресурсов, например дисковой ёмкости, под разворачивание там образа бд, не тратится время, на это разворачивание, скриптуется всё хорошо.
Вот такая, рабоче-крестьянская, концепт-архитектура, для рапид/лоукост-лепления тестовых баз, в практически произвольном кол-ве, от произвольной продовой бд. Вроде как должно хорошо заводится во всякие кубернетусы, скриптоваться.
Покритикуйте, по существу. Или поделитесь идеей, если можно, как у вас провиженг тестовых баз делается, если условия похожие.
Для полноты картины, упомяну так же.
Были мысли завести /dev/rbd0, в lvm-сборку какую то, или в zfs-пул. Тоже, для того чтобы соорудить какое то кеширование данных с /dev/rbd0 на локальный, для devdb-вм, диск. Но не получится: что zfs, что lvm - хотят сделать свою разметку на /dev/rbd0 и, соответственно - сломают образ фс, который на /dev/rbd0 есть.


Ещё посмотрел в сторону вариантов с подачей образа бд, из какой то кластерной фс, на клиентскую devdb-вм, в виде какой то файловой системы (cephfs, glusterfs, nfs, ...); Попробовал glusterfs: у него, если брики для вольюма, на peer-нодах кластера, собирать на thin-provisioned LV: в вольюме появляется функционал снапшотов и более - того снапшот-лаеринга. Т.е. можно будет сделать, от glusterfs-вольюма, снапшот. Активировать этот снапшот. От этого снапшота создать т.н. clone - это cow-снапшот, он будет зарегестрирован в glusterfs как вольюм.
Этот вольюм-клон: можно будет монтировать, как файловую систему (glusterfs, или есть вариант - по nfs) на стороне вм, клиентской, по отношению к glusterfs-кластеру. На этой клиентской машине, таким образом, становится видна, через эту, примонтированную фс, физ-компонента субд. Ну и, можно открываться и работать с ней.
Однако, если не устраивает работа с физ-компонентой тестовой бд, в такой схеме, ну, практически - через сеть (а я думаю - практически никого не устроит) ну, тогда, из вариантов - как тут уменьшить кол-во обращений к сетевому ресурсу просматривается только oracle-clonedb, со своей спецификой (это nfs и это EE). Поэтому: такое, хоть оно и явно попроще (в техническом смысле), мне нравится меньше схемы с ceph-ом и его rbd-интерфейсом - там и кеширование можно и к редакции субд привязки не возникает.
Спасибо за внимание, ваше время.
