Sometimes, tired of endless code review and debugging, you start wondering if there are ways to make your life easier. After some googling or merely by accident, you stumble upon the phrase, "static analysis". Let's find out what it is and how it can be used in your project.

Basically, if you write in any of the modern programming languages, you have already – without knowing this – run your code through a static analyzer. You see, any modern compiler provides a set, but only a tiny one, of warnings to report potential issues in your code. For example, when you compile C++ code in Visual Studio, you may see the following message:

With this output, the compiler is telling us that the var variable was never used anywhere in the function. So, you've actually been using a plain static code analyzer all this time. However, unlike professional analyzers such as Coverity, Klocwork, or PVS-Studio, compiler warnings identify only a small range of issues.
If you don't know what exactly static analysis is and how to adopt it, read this article to get a better understanding of the methodology.
In a word: to make development faster and easier.
Static analysis detects a huge variety of issues in source code: from incorrect use of language constructs to typos. Imagine, for example, that you accidentally write the following correct code:
as:
You can see a typo in the last line. PVS-Studio would report this error with the following warning:
V537 Consider reviewing the correctness of 'y' item's usage.
If you want to play around with this bug, try the ready-made snippet on Compiler Explorer: *click*.
Obviously, spots like that are not easily noticed and may cost you a good hour of debugging and wondering why the program behaves so weirdly.
Yet that bug was transparent enough. But what if your program doesn't work in the most optimal way because you forgot about some subtle peculiarity of the language? Or even ended up with undefined behavior? Unfortunately, things like that happen all around every day, and programmers spend the bulk of their time debugging acting up code flawed by typos, typical bugs, or undefined behavior.
It is to tackle such problems that static analysis was invented. It's an assistant that points out the various defects in your code to you and explains by means of included documentation why you shouldn't write one construct or another, what's bad about it, and how to fix it. Here's one example: *click*.
See the following articles for more examples of bugs that the analyzer can detect:
Now that you've learned of static analysis and become a follower of this methodology, you are probably eager to try it out. Where do you start? How to integrate a new tool into an existing project? How to help your team make friends with it? All these questions will be answered below.
Note. Static analysis does not replace nor cancels such a useful technique as code review. Instead, it complements code review by helping you notice and correct typos, non-optimal or dangerous constructs in good time. Code review becomes much more productive when you can focus on algorithms and readability of your code rather than hunting down a misplaced parenthesis or going through dull comparison functions.
Your trip starts with a trial version. Indeed, making a decision to adopt a new tool isn't easy when you have never seen it in action. That's why you should download the trial version first.
What you will learn at this step:
Once you've installed all the necessary components, the very first thing you should do is to analyze the entire project (Windows, Linux, macOS). Taking PVS-Studio as an example, the output that you will get in Visual Studio will look something like this:

The problem is that, when run on projects with a large code base, static analyzers will produce an enormous number of warnings. But you don't have to fix them all since your project is already working well enough, which means the issues reported by the analyzer aren't too critical. You can still take a look at the most interesting warnings and fix them if necessary. To do that, filter the output to have only the most relevant warnings left. In the PVS-Studio plugin for Visual Studio, this is done by filtering warnings by levels and categories. To have only the most accurate warnings visible, disable all levels but High and General:

Only 178 warnings were left, which is certainly easier to deal with than a few thousands…
Useful warnings may often be found under the Medium and Low tabs too, but the diagnostics included in these categories aren't very accurate (meaning a high probability of false positives). See the following article to learn more about the warning levels and ways of working with PVS-Studio on Windows: *click*.
Once you have examined (and fixed) the most relevant bugs, it's a good idea to suppress whatever warnings remain. This is done in order to prevent new warnings from getting lost among existing ones. After all, a static analyzer is an assistant rather than a list of bugs. :)
Now that the preliminary step is through, it's time to configure the plugins and integrate the tool into CI. This must be done before your team starts using the tool because they may forget to turn it on or even consciously ignore it. To counter that, you need to run a final check of the entire project to make sure this code was checked before merge.
What you will learn at this step:
Since no documentation is perfect, you will sometimes have to contact support. It's okay – we are eager to help. :)
Now we need to integrate with CI services. They actually allow smooth integration of any analyzer. You just need to add another pipeline step – normally following the build step and the unit tests. This can be done using various console utilities. For example, PVS-Studio provides the following utilities:
Integrating an analyzer into CI takes three steps:
For instance, to install PVS-Studio on Linux (Debian-base), you need to run the following commands:
On Windows-based systems, you can't install the analyzer using the package manager but you can still deploy it using the command line:
To learn more about deploying PVS-Studio on Windows-based systems, see *this guide*.
Once you've installed the analyzer, you need to run it. However, we recommend doing this after completing the compilation step and the tests because static analysis normally takes twice longer than compilation.
Since the choice of a particular way to run the analyzer depends on the platform and the project's details, I'll show how to do that for C++ code (on Linux) as an example:
The first command runs the analysis and the second converts the log into a text format, outputs it, and returns a non-zero code if any warnings have been issued. This mechanism is useful when you want the build process to halt should any errors be found. But you may remove the -w flag if you don't want the build to stop when warnings are issued.
Note. The text format is not very convenient. I suggested it above only as an example. Instead, take a look at the more appropriate FullHtml format, which supports code navigation.
To learn more about integrating the analyzer with CI, see the article "PVS-Studio and Continuous Integration" (for Windows) or "How to set up PVS-Studio in Travis CI" (for Linux).
Okay, you've got the analyzer up and running on your build server. From now on, should a team member submit unchecked code, the analysis step will crash, allowing you to detect the problem. It's not quite convenient, though, because a more effective practice is to check the project before merging the branches, at the step of creating a pull request, rather than after it.
Running analysis of pull requests isn't very different from running an ordinary check on CI except that you need to get a list of modified files. It can be usually obtained by requesting a diff between the branches using git:
Now you need to pass this list to the analyzer as input. In PVS-Studio, it's done using the -S flag:
See *this article* for more details about analyzing pull requests. Even if your CI service is not mentioned there, you'll still find useful the section on the general principles of this type of analysis.
Once you've configured the analyzer to check pull requests, you can have commits blocked if they contain warnings, thus setting up a boundary that unchecked code won't be able to pass.
That's all fine, of course, but you'd like to have all types of warnings gathered in one place – not only from the static analyzer but from the unit tests or dynamic analyzer as well. There's a variety of services and plugins allowing you to do that. For example, PVS-Studio comes with a plugin for SonarQube.
Now the time has come to install and configure the analyzer for everyday use as part of your development process. By now you have learned of most of the ways to run the analyzer, so this step may well be called the easiest part.
The simplest approach is to have your developers install the analyzer themselves, but it will take quite a while and distract them from work. Instead, you can automate this process using the installer and appropriate flags. PVS-Studio supports a number of flags for automatic installation. That said, you can still use package managers instead, such as Chocolatey (Windows), Homebrew (macOS), or dozens of ways available for Linux.
You will then need to install the necessary plugins – for Visual Studio, IDEA, Rider, etc.
At this point, we need to talk about techniques to speed up the analyzer in its everyday use. Full analysis of the whole project takes too long, but do we always modify all code at once? There hardly exists such global scale refactoring as to involve the entire code base. You don't normally modify more than a dozen files at a time, so why not check these files only? This is what the incremental analysis mode was made for. Don't worry, it's not yet another utility. It's just a special mode that allows checking only modified files and their dependencies. The check starts automatically after you finish building the project – given that you work in an IDE with the appropriate plugin installed.
If the analyzer detects issues in recently modified code, it will automatically inform you. PVS-Studio does this by showing the following message:
Of course, it won't help to simply tell your developers to just use the tool. You need to tell them what it's all about and what to do with it. Here are a few articles on getting started with PVS-Studio, but similar tutorials can be found for any other tool that you may choose:
Articles like these don't take long to read while providing developers with all the necessary information to start using the analyzer on an everyday basis. :)
At the preliminary step, after one of the first runs, we suppressed lots of warnings. It's a sad fact about static analyzers that they aren't perfect and tend to produce false positives. But you can usually suppress them with ease. In the PVS-Studio plugin for Visual Studio, you just need to click the button as shown below:
Actually, you are able not only to suppress warnings but also report them as false positives to our support. If they can be fixed, you'll notice how false positives specific to your own code base will be getting fewer and fewer with every new update.
We have finally passed all the steps of integrating static analysis into the development process. Despite all the importance of configuring static analyzers for use in CI, the developer's computer is the most critical spot. After all, a static analyzer is not some judge sitting on high and reproaching you for writing rubbish code. On the contrary, it's an assistant that suggests the right solutions when you are tired or reminds you whatever you may have forgotten.
Without regular use, however, static analysis would scarcely make your life any easier. Its strongest point is actually not in finding intricate and questionable spots as such, but in doing so in good time. Everyone will agree that finding a bug in modified code at the testing step is not only upsetting but also non-optimal. On the other hand, static analysis – when used regularly – examines every change immediately on your computer and informs you of any suspicious spots while you keep writing the code.
If you or your teammates still hesitate to adopt static analysis, I recommend reading the article "Why You Should Choose the PVS-Studio Static Analyzer to Integrate into Your Development Process". It addresses developers' typical concerns about static analysis being a waste of time and many more.

Basically, if you write in any of the modern programming languages, you have already – without knowing this – run your code through a static analyzer. You see, any modern compiler provides a set, but only a tiny one, of warnings to report potential issues in your code. For example, when you compile C++ code in Visual Studio, you may see the following message:
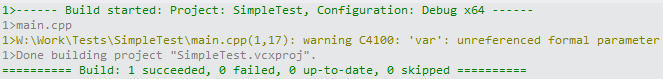
With this output, the compiler is telling us that the var variable was never used anywhere in the function. So, you've actually been using a plain static code analyzer all this time. However, unlike professional analyzers such as Coverity, Klocwork, or PVS-Studio, compiler warnings identify only a small range of issues.
If you don't know what exactly static analysis is and how to adopt it, read this article to get a better understanding of the methodology.
What is the purpose of static analysis?
In a word: to make development faster and easier.
Static analysis detects a huge variety of issues in source code: from incorrect use of language constructs to typos. Imagine, for example, that you accidentally write the following correct code:
auto x = obj.x;
auto y = obj.y;
auto z = obj.z;
as:
auto x = obj.x;
auto y = obj.y;
auto z = obj.y;
You can see a typo in the last line. PVS-Studio would report this error with the following warning:
V537 Consider reviewing the correctness of 'y' item's usage.
If you want to play around with this bug, try the ready-made snippet on Compiler Explorer: *click*.
Obviously, spots like that are not easily noticed and may cost you a good hour of debugging and wondering why the program behaves so weirdly.
Yet that bug was transparent enough. But what if your program doesn't work in the most optimal way because you forgot about some subtle peculiarity of the language? Or even ended up with undefined behavior? Unfortunately, things like that happen all around every day, and programmers spend the bulk of their time debugging acting up code flawed by typos, typical bugs, or undefined behavior.
It is to tackle such problems that static analysis was invented. It's an assistant that points out the various defects in your code to you and explains by means of included documentation why you shouldn't write one construct or another, what's bad about it, and how to fix it. Here's one example: *click*.
See the following articles for more examples of bugs that the analyzer can detect:
- Top 10 Bugs Found in C++ Projects in 2019
- Top 10 Bugs Found in C# Projects in 2019
- Top 10 Bugs Found in Java Projects in 2019
Now that you've learned of static analysis and become a follower of this methodology, you are probably eager to try it out. Where do you start? How to integrate a new tool into an existing project? How to help your team make friends with it? All these questions will be answered below.
Note. Static analysis does not replace nor cancels such a useful technique as code review. Instead, it complements code review by helping you notice and correct typos, non-optimal or dangerous constructs in good time. Code review becomes much more productive when you can focus on algorithms and readability of your code rather than hunting down a misplaced parenthesis or going through dull comparison functions.
0. Getting started with the tool
Your trip starts with a trial version. Indeed, making a decision to adopt a new tool isn't easy when you have never seen it in action. That's why you should download the trial version first.
What you will learn at this step:
- In what ways you can interact with the analyzer;
- Whether the analyzer is compatible with your IDE;
- What issues your projects currently have.
Once you've installed all the necessary components, the very first thing you should do is to analyze the entire project (Windows, Linux, macOS). Taking PVS-Studio as an example, the output that you will get in Visual Studio will look something like this:
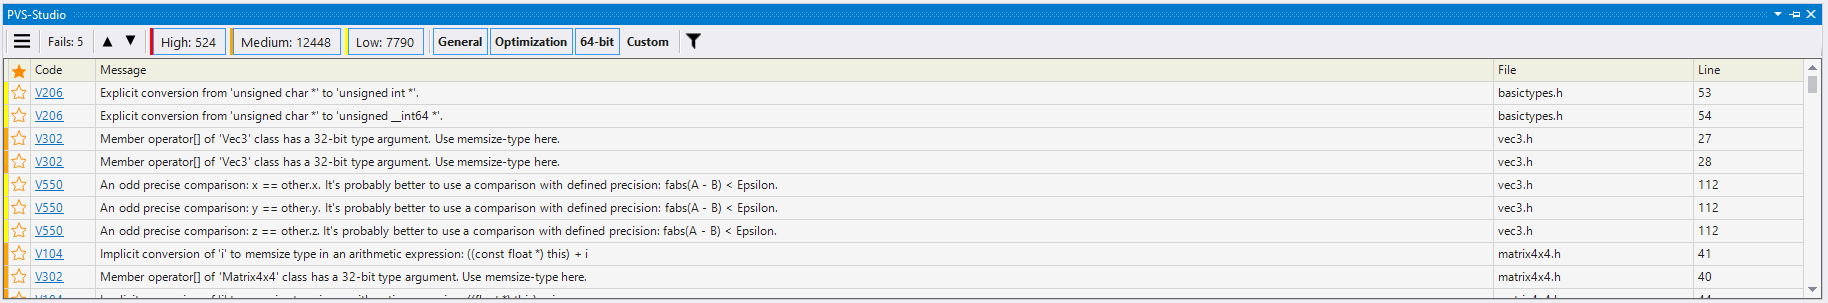
The problem is that, when run on projects with a large code base, static analyzers will produce an enormous number of warnings. But you don't have to fix them all since your project is already working well enough, which means the issues reported by the analyzer aren't too critical. You can still take a look at the most interesting warnings and fix them if necessary. To do that, filter the output to have only the most relevant warnings left. In the PVS-Studio plugin for Visual Studio, this is done by filtering warnings by levels and categories. To have only the most accurate warnings visible, disable all levels but High and General:
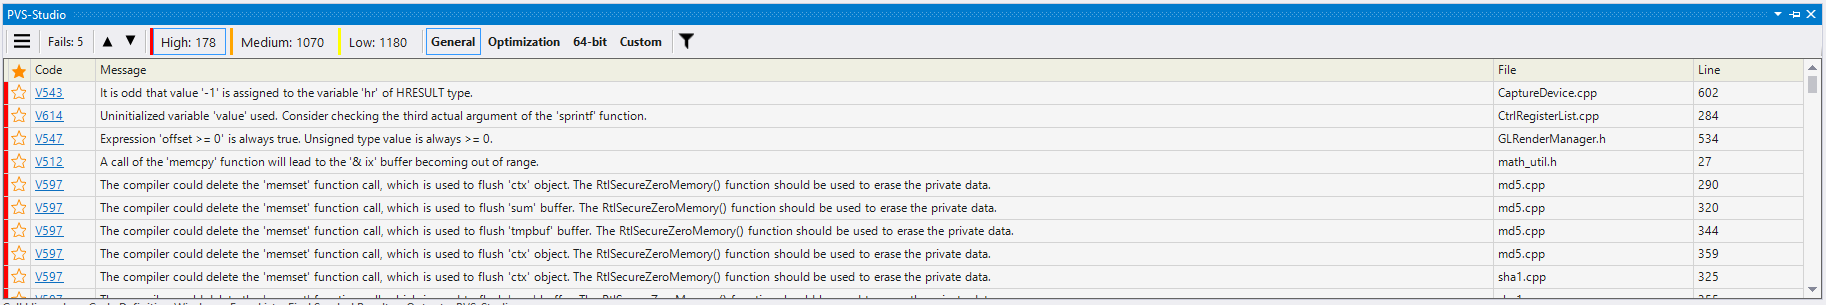
Only 178 warnings were left, which is certainly easier to deal with than a few thousands…
Useful warnings may often be found under the Medium and Low tabs too, but the diagnostics included in these categories aren't very accurate (meaning a high probability of false positives). See the following article to learn more about the warning levels and ways of working with PVS-Studio on Windows: *click*.
Once you have examined (and fixed) the most relevant bugs, it's a good idea to suppress whatever warnings remain. This is done in order to prevent new warnings from getting lost among existing ones. After all, a static analyzer is an assistant rather than a list of bugs. :)
1. Automation
Now that the preliminary step is through, it's time to configure the plugins and integrate the tool into CI. This must be done before your team starts using the tool because they may forget to turn it on or even consciously ignore it. To counter that, you need to run a final check of the entire project to make sure this code was checked before merge.
What you will learn at this step:
- How the tool can be automated;
- Whether the analyzer is compatible with your build system.
Since no documentation is perfect, you will sometimes have to contact support. It's okay – we are eager to help. :)
Now we need to integrate with CI services. They actually allow smooth integration of any analyzer. You just need to add another pipeline step – normally following the build step and the unit tests. This can be done using various console utilities. For example, PVS-Studio provides the following utilities:
- PVS-Studio_Cmd.exe (analysis of solutions, C# and C++ projects on Windows)
- CLMonitor.exe (compilation monitoring)
- pvs-studio-analyzer (analysis of C++ projects on Linux / macOS)
- pvs-studio-dotnet (analysis of solutions, C# projects on Linux / macOS)
- pvs-studio.jar (analysis of Java projects)
- PlogConverter (conversion of log files)
Integrating an analyzer into CI takes three steps:
- Install the analyzer;
- Run it;
- Deliver the results.
For instance, to install PVS-Studio on Linux (Debian-base), you need to run the following commands:
wget -q -O - https://files.viva64.com/etc/pubkey.txt \
    | sudo apt-key add -
sudo wget -O /etc/apt/sources.list.d/viva64.list \
  https://files.viva64.com/etc/viva64.list

sudo apt-get update -qq
sudo apt-get install -qq pvs-studio
On Windows-based systems, you can't install the analyzer using the package manager but you can still deploy it using the command line:
PVS-Studio_setup.exe /verysilent /suppressmsgboxes
/norestart /nocloseapplications
To learn more about deploying PVS-Studio on Windows-based systems, see *this guide*.
Once you've installed the analyzer, you need to run it. However, we recommend doing this after completing the compilation step and the tests because static analysis normally takes twice longer than compilation.
Since the choice of a particular way to run the analyzer depends on the platform and the project's details, I'll show how to do that for C++ code (on Linux) as an example:
pvs-studio-analyzer analyze -j8 \
                            -o PVS-Studio.log
plog-converter -t errorfile PVS-Studio.log --cerr -w
The first command runs the analysis and the second converts the log into a text format, outputs it, and returns a non-zero code if any warnings have been issued. This mechanism is useful when you want the build process to halt should any errors be found. But you may remove the -w flag if you don't want the build to stop when warnings are issued.
Note. The text format is not very convenient. I suggested it above only as an example. Instead, take a look at the more appropriate FullHtml format, which supports code navigation.
To learn more about integrating the analyzer with CI, see the article "PVS-Studio and Continuous Integration" (for Windows) or "How to set up PVS-Studio in Travis CI" (for Linux).
Okay, you've got the analyzer up and running on your build server. From now on, should a team member submit unchecked code, the analysis step will crash, allowing you to detect the problem. It's not quite convenient, though, because a more effective practice is to check the project before merging the branches, at the step of creating a pull request, rather than after it.
Running analysis of pull requests isn't very different from running an ordinary check on CI except that you need to get a list of modified files. It can be usually obtained by requesting a diff between the branches using git:
git diff --name-only HEAD origin/$MERGE_BASE > .pvs-pr.listNow you need to pass this list to the analyzer as input. In PVS-Studio, it's done using the -S flag:
pvs-studio-analyzer analyze -j8 \
                            -o PVS-Studio.log \
                            -S .pvs-pr.list
See *this article* for more details about analyzing pull requests. Even if your CI service is not mentioned there, you'll still find useful the section on the general principles of this type of analysis.
Once you've configured the analyzer to check pull requests, you can have commits blocked if they contain warnings, thus setting up a boundary that unchecked code won't be able to pass.
That's all fine, of course, but you'd like to have all types of warnings gathered in one place – not only from the static analyzer but from the unit tests or dynamic analyzer as well. There's a variety of services and plugins allowing you to do that. For example, PVS-Studio comes with a plugin for SonarQube.
2. Integration on the team's computers
Now the time has come to install and configure the analyzer for everyday use as part of your development process. By now you have learned of most of the ways to run the analyzer, so this step may well be called the easiest part.
The simplest approach is to have your developers install the analyzer themselves, but it will take quite a while and distract them from work. Instead, you can automate this process using the installer and appropriate flags. PVS-Studio supports a number of flags for automatic installation. That said, you can still use package managers instead, such as Chocolatey (Windows), Homebrew (macOS), or dozens of ways available for Linux.
You will then need to install the necessary plugins – for Visual Studio, IDEA, Rider, etc.
3. Everyday use
At this point, we need to talk about techniques to speed up the analyzer in its everyday use. Full analysis of the whole project takes too long, but do we always modify all code at once? There hardly exists such global scale refactoring as to involve the entire code base. You don't normally modify more than a dozen files at a time, so why not check these files only? This is what the incremental analysis mode was made for. Don't worry, it's not yet another utility. It's just a special mode that allows checking only modified files and their dependencies. The check starts automatically after you finish building the project – given that you work in an IDE with the appropriate plugin installed.
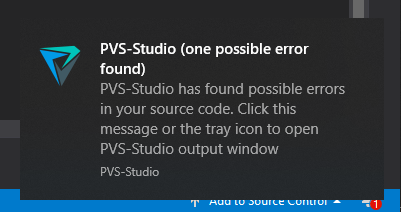
If the analyzer detects issues in recently modified code, it will automatically inform you. PVS-Studio does this by showing the following message:

Of course, it won't help to simply tell your developers to just use the tool. You need to tell them what it's all about and what to do with it. Here are a few articles on getting started with PVS-Studio, but similar tutorials can be found for any other tool that you may choose:
- Getting started with PVS-Studio on Windows (C, C++, C#)
- Getting started with PVS-Studio on Linux and macOS (C, C++)
- Getting started with PVS-Studio Java
Articles like these don't take long to read while providing developers with all the necessary information to start using the analyzer on an everyday basis. :)
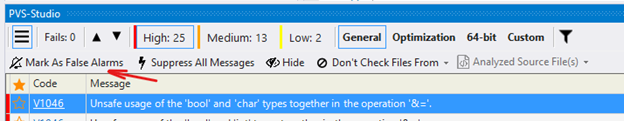
At the preliminary step, after one of the first runs, we suppressed lots of warnings. It's a sad fact about static analyzers that they aren't perfect and tend to produce false positives. But you can usually suppress them with ease. In the PVS-Studio plugin for Visual Studio, you just need to click the button as shown below:

Actually, you are able not only to suppress warnings but also report them as false positives to our support. If they can be fixed, you'll notice how false positives specific to your own code base will be getting fewer and fewer with every new update.
Post-integration
We have finally passed all the steps of integrating static analysis into the development process. Despite all the importance of configuring static analyzers for use in CI, the developer's computer is the most critical spot. After all, a static analyzer is not some judge sitting on high and reproaching you for writing rubbish code. On the contrary, it's an assistant that suggests the right solutions when you are tired or reminds you whatever you may have forgotten.
Without regular use, however, static analysis would scarcely make your life any easier. Its strongest point is actually not in finding intricate and questionable spots as such, but in doing so in good time. Everyone will agree that finding a bug in modified code at the testing step is not only upsetting but also non-optimal. On the other hand, static analysis – when used regularly – examines every change immediately on your computer and informs you of any suspicious spots while you keep writing the code.
If you or your teammates still hesitate to adopt static analysis, I recommend reading the article "Why You Should Choose the PVS-Studio Static Analyzer to Integrate into Your Development Process". It addresses developers' typical concerns about static analysis being a waste of time and many more.
