Introduction
In this article, I will cover the memory consumption of .NET applications on Linux. Firstly, we will try to understand the idea of virtual memory. Then, we will examine the memory statistics that Linux provides, such as RSS (Resident Set Size), VmData, RES (Resident Memory Size), and SWAP. Following that, we will delve into specifics related to the .NET.
Basic memory stats in Linux
Let’s create a basic ASP.NET application from the default template, publish it in framework-dependent mode and run it on Linux.
I’ve started the application on Linux and executed the top command.
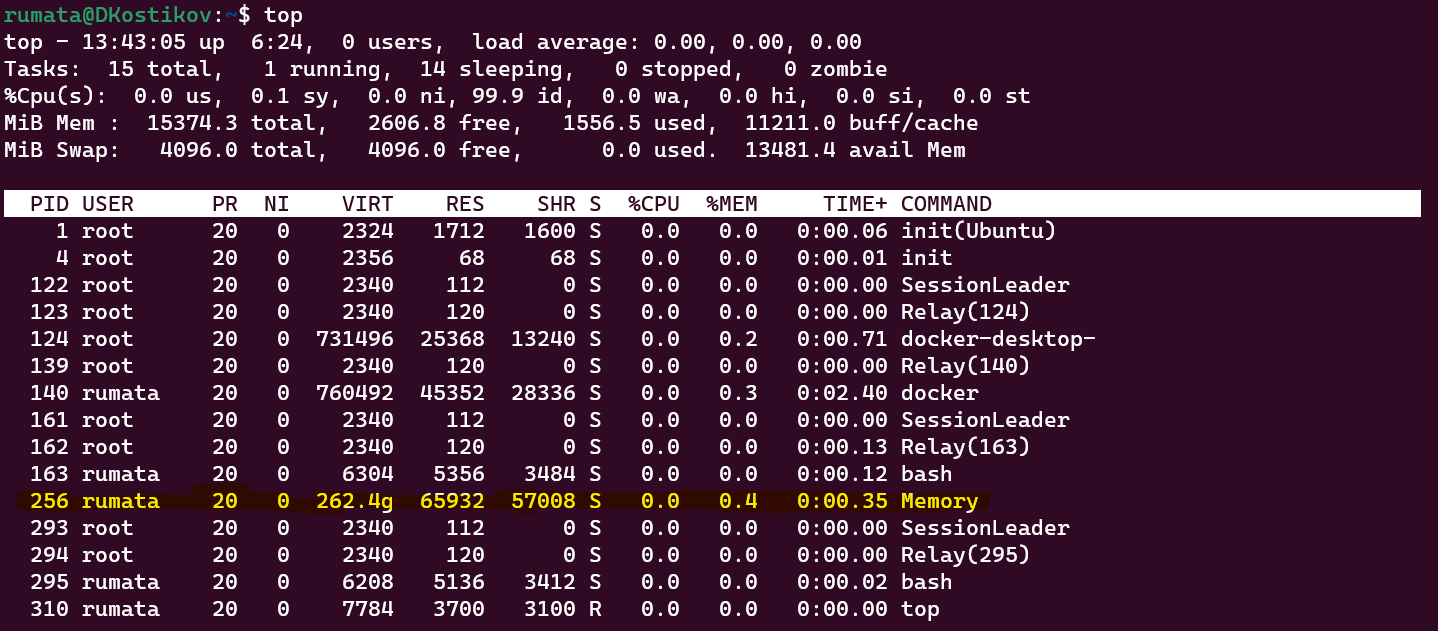
We have three memory-related statistics here: 262Gb, 66Mb and 57Mb, but how do we find the “true” memory consumption? Unfortunately, it’s impossible unless we understand the idea of virtual memory and the principles of memory allocation.
Virtual memory
In older operation systems and on devices like Arduino, you have direct access to physical memory. It means that operations like mov 0, 42 would actually load “42” to the very beginning of the CPU’s physical memory. But modern OSs like Linux and Windows, with help from CPU don’t give you access to physical memory. A mechanism called virtualisation is used instead.
Let’s say we have two processes which load some files from the disk and allocate some memory to store data.
Each of the processes has so-called virtual memory. Only virtual memory can be accessed inside the process. When you try to put 42 to a memory address like 7f849c021000 it doesn’t mean that this very address of the physical memory will be accessed. Moreover, it doesn’t mean any physical storage is allocated before you access it.

Let’s look at the diagram showing two processes and go through all the memory segments these processes have in the virtual memory space.
First process
Segment 1.1 - it’s a so-called anonymous memory. Anonymous memory is a memory that doesn’t correspond to any file on a disk. It’s a type of memory you get when calling malloc in c or new in C#.
Segment 1.2 It’s a memory-mapped file. When you read this memory at the beginning of the segment, you’ll get bytes from the beginning of the file. Memory-mapped files are a completely different approach than .NET File.Open or fopen in C. It is mainly used to load dynamic libraries (DLL in .NET and Windows and so in Linux). In this example, no physical memory is allocated. There can be two reasons for that. The first reason is this segment was never accessed, and the Linux kernel was too lazy to load it in advance. The second reason is that this file is rarely accessed, and the kernel removed it from physical memory. Nevertheless, the kernel will load the file or, most likely, only a small part of it into physical memory once the application tries to access memory from this segment.
Segment 1.3 is a memory-mapped file as well. It’s actively used, so the kernel loads all the content into the memory. This file and the physical memory range are shared with the second process.
Segment 1.4 is an anonymous memory-mapped file. This functionality allows for data exchange between processes. In .NET, the MemoryMappedFile class enables access to this feature.
This segment is shared between processes but not mapped to any disk file.
Second process
Segment 2.1 is the same as segment 1.3 of the first file
Segment 2.2 is the same as segment 1.4 of the first file
Segment 2.3 is an ordinary private anonymous memory like segment 1.1 from the first process.
Segment 2.4 is a memory-mapped file. The part of the file is frequently accessed, so the kernel allocated a physical memory for it, but some parts of this file are accessed very seldom or not accessed at all. That’s why the kernel hasn’t yet allocated physical memory for this file part.
Segment 2.5 is an anonymous segment like 2.2, and the process writes to all the parts of the segments, so it used to be fully allocated. Then, this memory was not accessed for a long time, and there was a shortage of physical memory, so the kernel decided to swap this segment to the disk swap segment.
Let’s try to generalise all these cases:
Anonymous vs. file-backed
We use an anonymous memory when we allocate some virtual memory via malloc or new.
When we want to map some disk file to a memory, we use a memory-mapped file.
There is a difference between virtual memory allocation by malloc and physical memory allocation. Unaccessed memory, in most cases, is not physically allocated.
The kernel tries not to hold unused data in physical memory. There can be two different cases:
For anonymous blocks, memory would be swapped, meaning that the kernel would write it to a swap segment
For a not modified file-backed memory, the kernel can throw away data from physical memory and read it once again on demand if a process doesn’t change it.
Linux memory stat
In Linux, there are several sources of memory-related information:
/proc/{proc id}/smaps most accurate and detailed information. Divided by individual segments.
/proc/{proc id}/smaps_rollup the same as previous but summed up.
/proc/{proc id}/status much faster but less accurate
top and ps same figures as above but less detailed
To get all the data at the same moment, I execute the following:
$ cat /proc/$(pgrep Memory)/smaps > mem.txt;cat /proc/$(pgrep Memory)/smaps_rollup;cat /proc/$(pgrep Memory)/status;pmap $(pgrep Memory) -x > smap.txt;top

559468e18000-7ffc8b1ef000 ---p 00000000 00:00 0                      	[rollup]
Rss:           	87812 kB
Pss:           	78760 kB
Pss_Anon:      	23416 kB
Pss_File:      	43144 kB
Pss_Shmem:     	12200 kB
Shared_Clean:  	16184 kB
Shared_Dirty:      	8 kB
Private_Clean: 	36052 kB
Private_Dirty: 	35568 kB
Referenced:    	84432 kB
Anonymous:     	23416 kB
LazyFree:          	0 kB
AnonHugePages: 	12288 kB
ShmemPmdMapped:    	0 kB
FilePmdMapped:     	0 kB
Shared_Hugetlb:    	0 kB
Private_Hugetlb:   	0 kB
Swap:              	0 kB
SwapPss:           	0 kB
Locked:            	0 kB


Name:   Memory
Umask:  0022
State:  S (sleeping)
Tgid:   10000
Ngid:   0
Pid:	10000
PPid:   169
TracerPid:  	0
Uid:	1000	1000	1000	1000
Gid:	1000	1000	1000	1000
FDSize: 256
Groups: 4 20 24 25 27 29 30 44 46 116 1000 1001
NStgid: 10000
NSpid:  10000
NSpgid: 10000
NSsid:  169
VmPeak: 275330800 kB
VmSize: 275248656 kB
VmLck:     	0 kB
VmPin:     	0 kB
VmHWM: 	87360 kB
VmRSS: 	87360 kB
RssAnon:       	23096 kB
RssFile:       	52128 kB
RssShmem:      	12136 kB
VmData:  1244932 kB
VmStk:   	132 kB
VmExe:    	92 kB
VmLib: 	42836 kB
VmPTE:   	700 kB
VmSwap:    	0 kB
HugetlbPages:      	0 kB
CoreDumping:	0
THP_enabled:	1
Threads:    	30
SigQ:   3/61471
SigPnd: 0000000000000000
ShdPnd: 0000000000000000
SigBlk: 0000000000000000
SigIgn: 0000000000001000
SigCgt: 00000003080344fe
CapInh: 0000000000000000
CapPrm: 0000000000000000
CapEff: 0000000000000000
CapBnd: 000001ffffffffff
CapAmb: 0000000000000000
NoNewPrivs: 	0
Seccomp:    	0
Seccomp_filters:    	0
Speculation_Store_Bypass:   	thread vulnerable
SpeculationIndirectBranch:  	conditional enabled
Cpus_allowed:   ffff
Cpus_allowed_list:  	0-15
Mems_allowed:   1
Mems_allowed_list:  	0
voluntary_ctxt_switches:    	70
nonvoluntary_ctxt_switches: 	2
top - 20:15:05 up 15:44,  0 users,  load average: 0.00, 0.01, 0.01
Tasks:  25 total,   1 running,  24 sleeping,   0 stopped,   0 zombie
%Cpu(s):  0.0 us,  0.0 sy,  0.0 ni,100.0 id,  0.0 wa,  0.0 hi,  0.0 si,  0.0 st
MiB Mem :  15374.3 total,	459.8 free,   1654.7 used,  13259.8 buff/cache
MiB Swap:   4096.0 total,   4095.2 free,  	0.8 used.  13380.6 avail Mem

  PID USER  	PR  NI	VIRT	RES	SHR S  %CPU  %MEM 	TIME+ COMMAND
  259 root  	20   0	2340	120  	0 S   0.0   0.0   0:00.60 Relay(260)
  260 rumata	20   0	6208   5196   3408 S   0.0   0.0   0:00.64 bash
  483 root  	20   0	2340	112  	0 S   0.0   0.0   0:00.00 SessionLeader
  484 root  	20   0	2340	120  	0 S   0.0   0.0   0:00.19 Relay(485)
  485 rumata	20   0	6340   5312   3416 S   0.0   0.0   0:00.17 bash
  882 root  	20   0	2340	112  	0 S   0.0   0.0   0:00.00 SessionLeader
  883 root  	20   0	2340	120  	0 S   0.0   0.0   0:00.03 Relay(884)
  884 rumata	20   0	6340   5272   3416 S   0.0   0.0   0:00.10 bash
  998 root  	20   0	2340	112  	0 S   0.0   0.0   0:00.00 SessionLeader
  999 root  	20   0	2340	120  	0 S   0.0   0.0   0:00.02 Relay(1000)
 1000 rumata	20   0	6324   5404   3560 S   0.0   0.0   0:00.04 bash
10000 rumata	20   0  262.5g  87360  64264 S   0.0   0.6   0:01.56 Memory
10289 rumata	20   0	2772	952	864 S   0.0   0.0   0:00.00 memtest_sf
Let’s take the most important values for each of these outputs and try to understand what do they mean and how to calculate them using smap.
There are two primary data sources I use to understand the meaning of these outputs deeply:
https://www.kernel.org/doc/Documentation/filesystems/proc.txt
https://man7.org/linux/man-pages/man5/proc.5.html
smaps_rollup
Rss: 87812 kB
RSS is a “the amount of the mapping that is currently resident in RAM” or, in other words, the physical memory consumption.
Pss:           	78760 kB
Pss_Anon:      	23416 kB
Pss_File:      	43144 kB
Pss_Shmem:     	12200 kB
“proportional share of this mapping.” I’ll cover this in more detail a little bit later.
Shared_Clean:  	16184 kB
Shared_Dirty:      	8 kB
Private_Clean: 	36052 kB
Private_Dirty: 	35568 kB
Each memory segment can be mapped by multiple processes. In this statistic, memory accessed by one process with sharable permissions will go to private. It will become shared only when the second process maps it.
Clean memory is a memory we haven’t modified. It can be either a memory-mapped file that we’ve loaded from the disk and haven’t modified or an anonymous memory we’ve mapped but haven’t written. Clean means that the kernel can swipe out this allocation from physical memory without writing it to the disk swap segment.
Referenced: 84432 kB
“the amount of memory currently marked as referenced or accessed.”
Anonymous: 23416 kB
“the amount of memory that does not belong to any file”. It’s a memory allocated when we use malloc in c or new in C#.
Anonymous memory can appear even in the file-backed segment when an application writes to this memory.
smap
smaps_rollup is a rollup of the very detailed smap which gives us details about each individual segment. It’s too large to put it here, but it has the same fields as the rollup version.
status
Before we go to the figures, it’s important to mention that all these values are inaccurate. Here is the quote from Linux documentation:
Some of these values are inaccurate because of a kernel-internal scalability optimization. If accurate values are required, use /proc/pid/smaps or /proc/pid/smaps_rollup instead, which are much slower but provide accurate, detailed information.
So, there always be some difference between process/ps/top and smap.
VmSize: 275248656 kB
Virtual memory size. It’s about 256Gb, which is an enormous amount of memory. I’ll explain why we see such a huge amount here a little bit later.
VmRSS: 87360 kB
Current virtual memory consumption.
VmRSS = RssAnon + RssFile + RssShmem
RssAnon: 23096 kB
It's the same as Anonymous from smap.
RssFile: 52128 kB
Memory-mapped files or, in other words, segments with non-empty file fields excluding the following file names:
[stack] and [heap] which go to anonymous
/memfd/* and /dev/shm/* which go to RssShmem
RssShmem: 12136 kB
Non-file-backed shared memory or, in other words, segments with /memfd/* and /dev/shm/* file names
VmSwap: 0 kB
Swapped memory
top
PID   USER  	PR  NI	VIRT	RES	   SHR   S  %CPU   %MEM   TIME+ COMMAND
10000 rumata	20   0  262.5g  87360  64264 S   0.0   0.6   0:01.56 Memory
Here we have the following figures
Virt is the same as VmSize. Don’t forget that here we have Gb, so we need to multiply it by 1024*1024, not 1000000, to get kb as in proc output.
Res is the same as VmRSS
Shr equals VmRSS - RssAnon
Pss
Here is the quote from the Linux documentation:
The following lines show the size of the mapping, the amount of the mapping that is currently resident in RAM ("Rss"), the process's proportional share of this mapping ("Pss")
So, RSS is an actual RAM consumption, but it includes all the shred segments. In our example in the “Virtual memory” paragraph, segments 1.3 and 1.4 will be counted in full for both processes. When I sum up RSS for both processes, segments 1.3 and 1.4 will be counted twice, which doesn’t correctly represent physical memory consumption.
Pss tries to mitigate this problem by measuring shared pages proportionally, so if 5 processes would use one shared file, pss would count only ⅕ of the consumption for each process.
Let’s try to start two instances of the application and look at the smaps_rollup of the same app instance when only one instance is running and when two instances are running.

…
Here, we can see that Pss was reduced just because of the start of another process.
How does .NET store the data?
Previously, we talked about general Linux concepts. Now, let’s talk about .NET. I would say that we have the following memory areas:
Heap
Stack
Let’s understand where each of these data types is located.
Heap
Let’s start with a small experiment. I’ve executed cat /proc/{proc id}/status against a tiny .net console program and got the following output:
VmSize: 275116856 kB
VmLck:     	0 kB
VmPin:     	0 kB
VmHWM: 	67668 kB
VmRSS: 	65932 kB
RssAnon:        	8924 kB
RssFile:       	47500 kB
RssShmem:       	9508 kB
VmData:   188776 kB
VmStk:   	132 kB
VmExe:    	92 kB
VmLib: 	41536 kB
VmPTE:   	596 kB
VmSwap:    	0 kB
Looks like my tiny program consumes 256GB of memory! In fact, this figure shows only the virtual memory. As you remember, not accessed virtual memory is not allocated, but let’s dive deeper.
We need to find segments with such high virtual memory consumption. It turns out that there is only one such segment:
7fa114001000-7fe088000000 ---p 00000000 00:00 0
Size:       	266141692 kB
KernelPageSize:    	4 kB
MMUPageSize:       	4 kB
Rss:               	0 kB
Pss:               	0 kB
Shared_Clean:      	0 kB
Shared_Dirty:      	0 kB
Private_Clean:     	0 kB
Private_Dirty:     	0 kB
Referenced:        	0 kB
Anonymous:         	0 kB
LazyFree:          	0 kB
AnonHugePages:     	0 kB
ShmemPmdMapped:    	0 kB
FilePmdMapped:     	0 kB
Shared_Hugetlb:    	0 kB
Private_Hugetlb:   	0 kB
Swap:              	0 kB
SwapPss:           	0 kB
Locked:            	0 kB
THPeligible:	1
VmFlags: mr mw me dd
As you can see, Rss is zero. Moreover, the program cannot write to this memory because of the permissions.
Why .NET needs this? That’s because .NET garbage collector needs continuous address space for the heap, so it allocates the maximum available amount of address space.
When we create a new huge object on the heap, .NET allocates a part of this address space with read-write permissions and lets the program use it.
Let’s see how it works. I have the following controller in my .NET application.
private static byte[] _hugeArray;
private static byte[] _tinyArray;

[HttpPost]
public void AllocateALot()
{
   var gb = 1 * 1024 * 1024 * 1024;
   _hugeArray = new byte[gb];

   _logger.LogInformation("AllocateALot done");
}


[HttpPost]
public void AllocateALittle()
{
   _tinyArray = new byte[1024];

   _logger.LogInformation("AllocateALittle done");
}


[HttpPost]
public void WriteHuge(int index)
{
   _hugeArray[index] = 1;

   _logger.LogInformation("WriteHuge done");
}


[HttpPost]
public void WriteTiny(int index)
{
   _tinyArray[index] = 1;

   _logger.LogInformation("WriteTiny done");
}
I started my application and executed the following commands
$ cat /proc/$(pgrep Memory)/smaps > mem_before.txt

$ curl -X 'POST'   'http://localhost:5000/Experiments/AllocateALot'

$ cat /proc/$(pgrep Memory)/smaps > mem_after.txt
I used a Python script for smap analysis, and here are the results (size in Mb).

.NET reduced that enormous segment and created two new segments. The size of the new array is 1Gb but only 2Mb was actually allocated.
But let’s try to write something to this array. I’m going to write exactly in the middle of the array
$ curl -X 'POST' 'http://localhost:5000/Experiments/WriteHuge?index=536870912'

As we can see, RSS has grown from 2Kb to 4Kb, as one more page was allocated in the middle of the segment.
Let’s allocate a tiny array as well. I’m not expecting .NET to create a new segment for it; that’s why I use a dotnet-dump to get an address of this variable.
$ ./dotnet-dump collect -p $(pgrep Memory) --type Full

Writing full to /home/rumata/core_20231105_131345
Complete
$ ./dotnet-dump analyze /home/rumata/core_20231105_131345
> dumpheap -type Memory.Controllers.ExperimentsController
     	Address           	MT       	Size
	7ec94f814438 	7f093cbd19b0         	24
	7ec950408480 	7f093cbd19b0         	24
	7ec951c31628 	7f093cbd19b0         	24
	7ec951c31b88 	7f093d5dd1e8         	24

Statistics:
      	MT Count TotalSize Class Name
7f093d5dd1e8 	1    	24 Microsoft.Extensions.Logging.Logger<Memory.Controllers.ExperimentsController>
7f093cbd19b0 	3    	72 Memory.Controllers.ExperimentsController
Total 4 objects, 96 bytes

> dumpobj 7ec94f814438
Name:    	Memory.Controllers.ExperimentsController
MethodTable: 00007f093cbd19b0
EEClass: 	00007f093cbb7c20
Tracked Type: false
Size:    	24(0x18) bytes
File:    	/home/rumata/MemoryTest/Memory.dll
Fields:
          	MT	Field   Offset             	Type VT 	Attr        	Value Name
00007f093a5e9238  4000008    	8 ...s.Logging.ILogger  0 instance 00007ec951c31b88 _logger
00007f09396f41c0  4000007    	8      	System.Void  0   static 0000000000000000 _file
00007f093a5ba158  4000009   	10    	System.Byte[]  0   static 00007ec978000040 _hugeArray
00007f093a5ba158  400000a   	18    	System.Byte[]  0   static 00007ec94f814530 _tinyArray
I look at the MT(method table) to get the instance of the correct type, and I can choose any instance because I’m interested in a static field.
Now I can find the segment where this field sits:

This particular allocation hasn’t changed any memory consumption figures. The memory was allocated in the existing segment, and physical RAM was allocated for this area earlier. It means that we can’t see this particular allocation in any Linux memory statistics.
Stack
The easiest way to get the addresses of all the threads is to create a dump via dotnet-dump and then execute sos EEStack command.
$ ./dotnet-dump collect -p $(pgrep Memory) --type Full
$ ./dotnet-dump analyze /home/rumata/core_20231130_190143
> sos EEStack
The output would include stack traces for all the threads, including stack addresses of each frame. Let’s get the bottom frame for each thread and then map it to the segments list.

The last column here shows the thread ID of a thread which uses this segment as a stack.
Let’s discuss the sizes of the stack segments. In Linux, the stack segment for the initial thread has a dynamic size. It’s located at the bottom of the address space and has a lot of space to grow. Keep in mind the stack grows from the lower addresses to higher addresses.

So, once the program tries to access the memory out of the initially allocated space, the system will intercept the segmentation fault and enlarge the segment. But there is still a limit. You can get it by executing the following:
$ ulimit -s
8192
This value is used as a default thread size for all other threads as well, but can be overridden using the following .NET overload:
public Thread (System.Threading.ThreadStart start, int maxStackSize);
An interesting fact for readers who began with the .NET Framework on Windows: early versions of the .NET Framework committed all the stack memory, which is 1Mb by default on Windows. Commit allocates some space in the swap file or physical RAM to ensure that there will be no out-of-memory under any circumstances. In Linux, there is no such idea of memory commit because it treats physical memory plus swap as a nearly unlimited resource and allows overallocation. The only way to ensure that virtual space is backed by physical RAM is to access it. But on Linux .NET don’t try to access all the stacks to be sure that all the memory is physically allocated and stack overflow can be handled gracefully. The positive side of this approach is small memory consumption by the stacks. As you can see in our example, all the stacks consume less than 50k RSS
Conclusion
Thus, to understand Linux memory statistics, we dived into the idea of virtual address space. This knowledge allowed us to understand all the most important metrics like RSS, anonymous and file-backed, private and shared memory. Considering all these, we revealed how .NET stores data in the heap and the stack.
Understanding these mechanisms is important for optimising .NET applications and ensuring their efficient operation in a Linux environment.
